
8 Standard Costs and Variance Analysis

Learning Objectives LO
LO1 Describe the purpose of standard costs used for manufacturing costs
LO2 Compute the direct materials price and quantity variances and explain their significance
LO3 Compute the direct labor rate and efficiency variances and explain their significance
LO4 Compute the variable manufacturing overhead rate and efficiency variances and explain their significance
Purpose of standard costs LO1
Standards are cost or revenue targets used to make financial projections and evaluate performance. The cost formulas used for budgeting are considered standards. Standards set forth the expected revenue or cost for a particular item. For example, if the cost formula for supplies is $3 per unit ($3Q), it is also considered the standard cost for supplies. Managers can use the standard cost formula to make projections about supplies expense or to evaluate the actual amount spent on supplies.
All manufacturing and the costs associated with providing services should have established standard cost targets. This chapter focuses on standard costs and standard cost variances related to variable manufacturing costs. Manufacturing costs, or the cost incurred to manufacture a product for resell, are also known as product costs. As discussed in previous chapters, three categories comprise total product cost—direct material, direct labor, and manufacturing overhead. Standard costs are established for all three categories of product costs.
Standards for variable manufacturing costs include both quantity and price standards. The quantity standard establishes how much of an input is needed to make a product or provide a service. The price standard specifies how much each quantity of input should cost. These standards can be used to make financial projections and to evaluate performance by comparing the standards to actual performance at the end of the period. Any discrepancy between the standard and actual costs is known as a variance. Standard variances are considered a red flag for management to investigate and determine their cause.
Direct material and direct labor are considered variable manufacturing costs, since the total amount for these costs changes based on production. Manufacturing overhead is typically a mixed cost consisting of a variable and a fixed component. Fixed manufacturing overhead is, by definition, fixed and should not change as long as production remains within the relevant range. The fixed portion of manufacturing overhead is analyzed by comparing the projected or budgeted amount of fixed manufacturing overhead to the actual amount of fixed overhead incurred using the same process presented in the flexible budgeting chapter. The total amount of variable manufacturing overhead changes based on production so it has a quantity and price standard. Since direct material, direct labor, and variable manufacturing overhead have quantity and price standards, they are analyzed using the standard costs variance analysis method presented in this chapter.
The example of the NoTuggins dog harness is used throughout this chapter to illustrate standard costs and standard costs variances for product costs. Brad invented NoTuggins, a revolutionary dog harness that stops dogs from pulling when connected to a leash by humanely redistributing the dog’s pulling force. Dogs are unable to move forward until they quit pulling. NoTuggins was featured as the most innovative new harness by the International Kennel Association. Brad sold 150,000 units of NoTuggins during the first year of operations. Although the product was selling well, product costs were higher than expected, translating into lower profits. Brad decided to conduct a standard costs variance analysis to see if he could isolate the issue, or issues. The standard costs to make one unit of NoTuggins and the actual production costs data for the period are presented in Exhibit 8-1 below.
Exhibit 8-1 Standard costs to make one unit of NoTuggins and the actual production data

Standard costs
As shown in Exbibit 8-1, Brad projects that the standard variable cost to make one unit of product is $7.35. NoTuggins requires one type of direct material, a flat nylon cord. He estimates that each unit should require 4.2 feet of flat nylon cord that costs $0.50 per foot for total direct material costs per unit of $2.10. Each unit should require 0.25 direct labor hours to assemble at an average rate of $18 per hour for total direct labor costs of $4.50 per unit. Variable manufacturing overhead costs are applied to the product based on direct labor hours. The standard variable manufacturing overhead rate is $3 per direct labor hour. Each unit should require 0.25 direct labor hours for total variable manufacturing overhead costs per unit of $0.75. It is important to note that cost standards are established before the work is started. Production managers are responsible for controlling costs and meeting the target cost, which is $7.35 per unit in this case.
Actual manufacturing data
Actual manufacturing data are collected after the period under consideration is finished. Actual data includes the exact number of units produced during the period and the actual costs incurred. During the period, Brad produced 150,000 units of NoTuggins. The actual costs and quantities incurred for direct materials, direct labor, and variable manufacturing overhead are reported in Exhibit 8-1.
Total variable manufacturing costs variance
Refer to the bottom section of Exhibit 8-1. At the beginning of the period, Brad projected that the standard cost to produce one unit should be $7.35. During the period, he actually produced 150,000 units. Per the standard, total variable production costs should have been $1,102,500 (150,000 units x $7.35). However, Brad actually incurred $1,284,000 in variable manufacturing costs. Actual variable manufacturing costs incurred were $181,500 over the budgeted or standard amount.
Knowing that variable manufacturing costs were $181,500 over budget is helpful, but it doesn’t isolate the production issue or issues. Therefore, the next step is to individually analyze each component of variable manufacturing costs. The total variable manufacturing costs variance is separated into direct materials variances, direct labor variances, and variable manufacturing overhead variances. Each of these variances are discussed in detail in the following sections.
Video Illustration 8-1: Standard costs for manufacturing costs
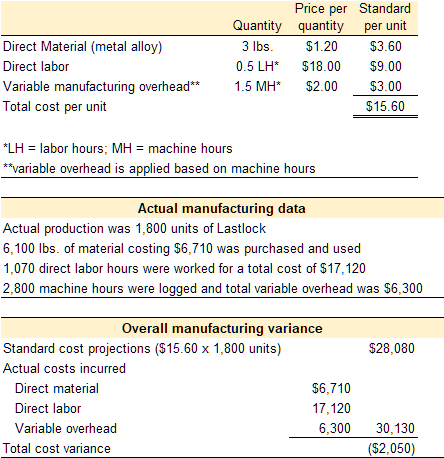
Patty invented a virtually indestructible bicycle lock called Lastlock. The lock is lightweight, retractable, and fits easily in a jacket pocket. Sales of Lastlock skyrocketed when a local celebrity posted about Lastlock on social media. While the sudden increase in sales demand was exciting, Patty was not expecting the sudden increase in production so she experienced a number of production issues. In particular, she ran out of the alloy used to make Lastlock and was forced to purchase a lower quality batch from a different supplier. The lower quality batch, however, was significantly cheaper than the normal alloy. Also, to meet demand she had to hire an additional fabricator. Although the new fabricator was less experienced, her pay rate per hour was lower. Since she paid less for the material and labor, Patty assumed that at the end of the period overall manufacturing costs would be lower than projected. However, manufacturing costs were higher than expected at the end of the period. Accordingly, Patty decided to perform a standard cost variance analysis on the variable manufacturing costs.
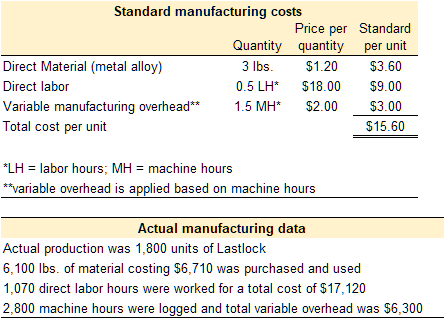
The standard quantity and price to make one unit of Lastlock are provided below. The actual costs and quantities are also provided.
Exhibit 8-2 Using standard costs to analyze manufacturing costs overview and video explanation
Check your understanding LO1
Direct materials variances LO2
Standard costs are established for all direct materials used in the manufacturing process. Direct materials include all materials that can be easily and economically traced to the production of a product. For example, the direct materials necessary to produce a wood desk might include wood and hardware. Indirect materials are not easily and economically traced to a particular product. Examples of indirect materials are items such as nails, screws, sandpaper, and glue. Indirect materials are included in the manufacturing overhead category, not the direct materials category.
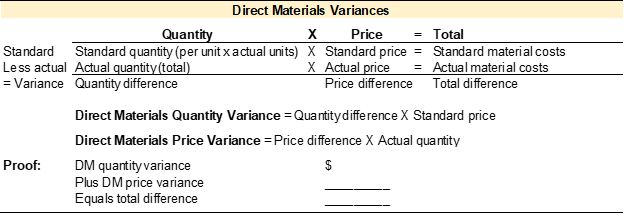
At the highest level, standard costs variance analysis compares the standard costs and quantities projected with the amounts actually incurred. Standard costs and quantities are established for each direct material. These standards are compared to the actual quantities used and the actual price paid for each category of direct material. Any variances between standard and actual costs are caused by a difference in quantity or a difference in price. Therefore, the total variance for direct materials is separated into the direct materials quantity variance and the direct materials price variance. The template provided in Exhibit 8-3 can be used to compute the total direct material variance, direct material quantity variance, and direct material price variance.
Exhibit 8-3 Template to compute the total direct materials variance, direct materials quantity variance, and direct material price variance
 To illustrate standard costs variance analysis for direct materials, refer to the data for NoTuggins in Exhibit 8-1 above. NoTuggins requires one type of direct material, flat nylon cord. The direct material standards for one unit of NoTuggins are 4.2 feet of flat nylon cord that costs $0.50 per foot for a total direct material cost per unit of $2.10. During the period, 600,000 feet of flat nylon cord costing $330,000 were purchased and used.
The direct material variances for NoTuggins are presented in Exhibit 8-4 below.
Exhibit 8-4 Direct materials variances for NoTuggins

Total direct material variance
The standard and actual amounts for direct materials quantities, prices, and totals are calculated in the top section of the direct materials variance template. This data comes from the accounting records. After the total direct materials variance is calculated in the top section, the amounts from the top section can be plugged into the formulas given in the next section to compute the direct materials quantity and price variances. All standard cost variances are calculated using the actual production quantity as the cost driver. The goal is to determine how much should have been incurred to produce the actual quantity of units produced and compare that to how much was actually incurred to produce the actual quantity of units produced.
The direct materials variances for NoTuggins are presented in Exhibit 8-4. Refer to the total direct materials variance in the top section of the template. Total standard quantity is calculated as standard quantity per unit times actual production or 4.2 feet of flat nylon cord per unit times 150,000 units produced equals 630,000 feet of flat nylon cord. The standard cost per foot was established as $0.50. Total direct material costs per the standard amounts allowed are the total standard quantity of 630,000 ft. times the standard price per foot of $0.50 equals $315,000. Per the standard cost formulas, Brad projected he should have paid $315,000 for the direct materials necessary to produce 150,000 units.
The total amounts for direct materials actually purchased and used are reported on the following line. Actual amounts are pulled from the accounting records. The actual quantity purchased and used to produce 150,000 units was 600,000 feet of flat nylon cord costing $330,000. The actual price of $0.55 per unit is not given in the actual data presented in Exhibit 8-1. However, it can be calculated by taking the total purchase price and dividing it by the total number of feet purchased.
The total variances can be calculated in the last line of the top section of the template by subtracting the actual amounts from the standard amounts. The standard quantity allowed of 630,000 feet is subtracted from the actual quantity purchased and used of 600,000 feet, yielding a variance of 30,000 feet. Variances are considered favorable (F) or unfavorable (U). Variances are favorable if the standard amount is more than the actual amount. When using the template format presented in this chapter, positive variances are favorable and negative variances are unfavorable. In the NoTuggins example, the total standard direct materials allowed was 630,000 feet. However, they were able to produce the 150,000 units using less material, which is favorable. If the actual amount exceeds the standard amount, the variance is unfavorable (U) indicating they used or paid more than the standard amount, which is unfavorable.
The total price per unit variance is the standard price per unit of $0.50 less the actual price paid of $0.55 equals the price variance per unit of $(0.05) U. This is unfavorable because they actually spent more per unit than the standards allowed. Also, on the template, negative numbers are considered unfavorable.
The total direct materials variance is calculated as the total standard costs allowed for direct materials of $315,000 less the actual amount paid of $330,000 equal the total direct materials variance of $(15,000) U. Overall, Brad spent $15,000 more on direct materials than he projected.
The completed top section of the template contains all the numbers needed to compute the direct materials quantity and price variances. Students do not need to refer to the dataset to get additional data. The direct materials quantity and price variances are used to determine if the overall variance is a quantity issue, price issue, or both.
Direct materials quantity variance
Refer to Exhibit 8-4. The direct materials quantity variance is calculated as the total direct materials quantity difference times the standard price per unit. The direct materials quantity difference is 30,000 F. Since the quantity difference is favorable, this variance will be favorable. The standard price per unit is $0.50. The direct materials quantity variance is 30,000 F x $0.50 = $15,000 F.
This result is interpreted as the organization saved $15,000 in direct materials costs by using less direct material per unit than they planned. It is important to remember that standards are the planned or projected amounts. Although this is a positive variance, it should still be investigated. It could mean that the direct materials quantity standard needs to be reduced to achieve an accurate standard variable cost per unit. Or, further investigation might reveal a production error in which the units were improperly sized, which is a significant quality control issue.
Direct materials price variance
Refer to Exhibit 8-4. The direct materials price variance is calculated as the per unit price difference times the actual quantity purchased and used. The price difference is $(0.05) U. Since the per unit price difference is unfavorable, this variance will be unfavorable. The actual quantity purchased and used is 600,000 feet. Actual quantity is used in this calculation to determine the total price variance for the actual quantity purchased and used during the period. The direct materials price variance is $(0.05) U x 600,000 = $30,000 U.
This result is interpreted as the organization paid $30,000 more for materials used in production than they planned. All variances should be investigated. This direct materials price variance could indicate a purchasing issue, such as the purchasing department paying more than the agreed-upon amount (purchase order amount). Or the cause could be a supplier or sourcing issue in which the material can be sourced cheaper elsewhere. Another possibility is that the direct material price standard needs to be increased because prices have increased. Or, it could be caused by another issue.
Video Illustration 8-2: Computing direct materials variances
Using the standard and actual data given for Lastlock and the direct materials variance template, compute the direct materials variances.
Exhibit 8-5 Computing direct materials variances and video explanation
Check your understanding LO2
Direct labor variances LO3
Standard costs are established for all direct labor used in the manufacturing process. Direct labor is considered manufacturing labor costs that can be easily and economically traced to the production of the product. For example, the direct labor necessary to produce a wood desk might include the wages paid to the assembly line workers. Indirect labor is labor used in the production process that is not easily and economically traced to a particular product. Examples of indirect labor include wages paid to the production supervisor or quality control team. While they are a part of the production process, it would be difficult to trace these wages to the production of a single desk. Indirect labor is included in the manufacturing overhead category, not the direct labor category.
Standard costs and quantities are established for each type of direct labor. These standards are compared to the actual number of direct labor hours worked and the actual rate paid for each type of direct labor. When discussing direct labor, price is referred to as rate, and quantity is referred to as efficiency. Variances between the standard and actual amounts are caused by a difference in efficiency or rate. The total direct labor variance is separated into the direct labor efficiency and direct labor rate variances.
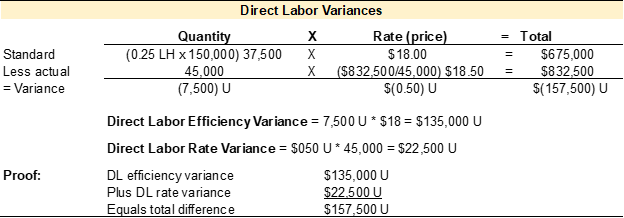
A template to compute the total direct labor variance, direct labor efficiency variance, and direct labor rate variance is provided in Exhibit 8-6.
Exhibit 8-6 Template to compute total direct labor variance, direct labor efficiency variance, and direct labor rate variance

To illustrate standard costs variance analysis for direct labor, refer to the data for NoTuggins in Exhibit 8-1 above. Each unit requires 0.25 direct labor hours at an average rate of $18 per hour for a total direct labor cost of $4.50 per unit. During the period, 45,000 direct labor hours were worked and $832,500 was paid for direct labor wages.
The direct labor variances for NoTuggins are presented in Exhibit 8-7 below.
Exhibit 8-7 Direct labor variances for NoTuggins
Total direct labor variance
The standard and actual amounts for direct labor hours, rates, and totals are calculated in the top section of the direct labor variance template. This data comes from the accounting records. Once the top section is complete, the amounts from the top section can be plugged into the formulas to compute the direct labor efficiency (quantity) and rate (price) variances. All standard cost variances are computed using the actual production quantity. The goal is to determine how much should have been incurred to produce the actual quantity of units produced and compare that to how much was actually incurred to produce the actual quantity of units produced.
The direct labor variances for NoTuggins are presented in Exhibit 8-7. Refer to the total direct labor variance in the top section of the template. Total standard quantity is calculated as standard quantity per unit times actual production or 0.25 direct labor hours per unit times 150,000 units produced equals 37,500 direct labor hours. The standard labor rate per hour was established as $18. Total direct labor costs per the standard amounts allowed are calculated as total standard quantity (37,500) times standard rate per hour ($18) equals $675,000. During the period, Brad projected he should pay $675,000 for direct labor to produce 150,000 units.
The actual amounts incurred are reported on the following line. Actual amounts are pulled from the accounting records. During the period, 45,000 direct labor hours were worked to produce 150,000 units at an actual cost of $832,500. The actual hourly rate is not given in the data presented in Exhibit 8-1. However, it can be calculated by dividing the total price paid for direct labor by the total number of hours worked, $832,500/45,000 = $18.50 actual rate per hour.
The total direct labor variance can be calculated in the last line of the top section by subtracting the actual amounts from the standard amounts. The standard quantity allowed of 37,500 direct labor hours less the actual hours worked of 45,000 hours yields a variance of (7,500) direct labor hours. This variance is unfavorable because the actual hours worked exceed the standard hours allowed. On the template, negative numbers are considered unfavorable. The direct labor rate per hour variance is calculated as the projected standard direct labor rate of $18 per hour, less the actual direct labor rate of $18.50, which yields a $(0.50) unfavorable per hour rate variance. The total direct labor variance is the total standard labor costs allowed of $675,000 less the actual amount paid for direct labor of $832,500, which is $(157,500) unfavorable. Overall, Brad spent $157,500 more on direct labor than projected.
The completed top section of the template contains all the numbers needed to compute the direct labor efficiency (quantity) and direct labor rate (price) variances. Students do not need to refer to the dataset to get additional data. The direct labor efficiency and rate variances are used to determine if the overall direct labor variance is an efficiency issue, rate issue, or both.
Direct labor efficiency variance
The direct labor efficiency variance is calculated as the total direct labor hours difference times the standard direct labor rate per hour. The quantity difference is (7,500) U. Since the difference is unfavorable, this variance will be unfavorable. The standard rate per hour is $18. The direct labor efficiency variance is (7,500) U x $18 = $135,000 unfavorable.
The organization spent $135,000 for the direct labor hours that exceeded the standard number of hours allowed. As with any variance, this is the starting point for further investigation. An investigation may reveal that employees took longer than 0.25 hours to make each unit, which could mean additional training or another appropriate solution.
Direct labor rate variance
The direct labor rate variance is calculated as the direct labor rate difference times the actual number of direct labor hours worked. The direct labor rate difference is $(0.50) U. Since the difference is unfavorable, this variance will be unfavorable. The actual number of hours worked is 45,000 direct labor hours. The actual number of direct labor hours worked is used in this calculation to determine the total variance amount for the actual hours worked during the period. The direct labor rate variance is $(0.50) U x 45,000 = $22,500 U.
Due to the higher than planned hourly rate, the organization paid $22,500 more for direct labor than they planned. This variance should be investigated to determine if the actual wages paid for direct labor can be lowered in future periods or if the standard direct labor rate per hour needs to be adjusted. For example, an investigation could reveal that the company had to pay a higher rate to attract employees, so the standard hourly direct labor rate needs to be adjusted.
Video Illustration 8-3: Computing direct labor variances
Using the standard and actual data given for Lastlock and the direct labor variance template, compute the direct labor variances.
Exhibit 8-8 Computing direct labor variances and video explanation
Check your understanding LO3
Variable manufacturing overhead variances LO4
Standard cost projections are established for the variable and fixed components of manufacturing overhead. Manufacturing overhead includes all costs incurred to manufacture a product that are not direct material or direct labor. Examples of manufacturing overhead are indirect materials, e.g., nails and glue; indirect labor, e.g., wages for the production supervisor or quality control; and all other production costs, e.g., costs incurred on the factory, such as rent, utilities, and insurance.
The fixed component of manufacturing overhead is comprised of overhead costs that stay the same in total regardless of the quantity produced or another cost driver. For example, rent expense for the production factory is the same every month regardless of how many units are produced in the factory. Rent expense is considered a fixed cost. Within the relevant range of production, fixed costs do not have a quantity standard, only a price standard. Fixed manufacturing overhead is analyzed by comparing the standard amount allowed to the actual amount incurred.
A cost driver, typically the production units, drives the variable component of manufacturing overhead. As with any variable cost, the per unit cost is constant, but the total cost depends on the quantity produced or another cost driver. The focus of this section is variable manufacturing overhead since it has both a quantity and price standard.
As mentioned previously, standard rates and quantities are established for variable manufacturing overhead. When discussing variable manufacturing overhead, price is referred to as rate, and quantity is referred to as efficiency. These standards are compared to the actual quantities used and the actual rate paid for variable manufacturing overhead using the same processes applied in previous sections to analyze direct materials and direct labor. Any variance between the standard costs allowed and the actual costs incurred is caused by a difference in efficiency or a difference in rate. The total variance for variable manufacturing overhead is separated into the variable manufacturing overhead efficiency variance and the variable manufacturing overhead rate variance.
A template to compute the total variable manufacturing overhead variance, variable manufacturing overhead efficiency variance, and variable manufacturing overhead rate variance is provided in Exhibit 8-9.
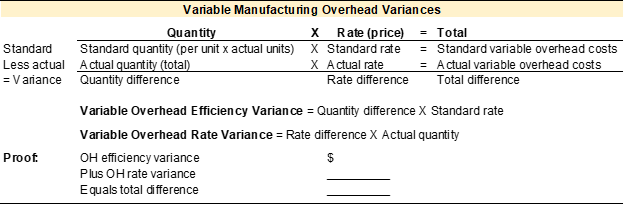
Exhibit 8-9 Template to compute total variable manufacturing overhead variance, variable manufacturing overhead efficiency variance, and variable manufacturing overhead rate variance
 To illustrate standard costs variance analysis for variable manufacturing overhead, refer to the data for NoTuggins in Exhibit 8-1 above. Variable manufacturing overhead is applied based on direct labor hours. Per the standards, the variable manufacturing overhead rate is $3 and each unit requires 0.25 direct labor hours. The total standard variable manufacturing overhead cost per unit is $0.75. During the period, 45,000 direct labor hours were actually worked and actual variable manufacturing overhead of $121,500 was incurred.
The variable manufacturing overhead variances for NoTuggins are presented in Exhibit 8-10 below.
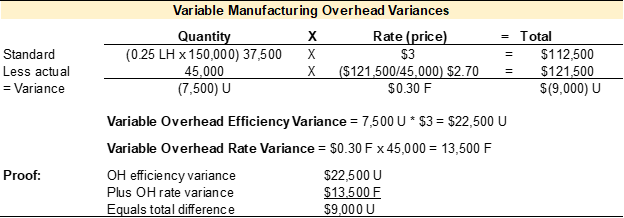
Exhibit 8-10 Variable manufacturing overhead variances for NoTuggins
Total variable manufacturing overhead variance
The standard and actual amounts for the variable manufacturing overhead cost driver (direct labor hours in this case), the overhead rate per unit of the cost driver, and total variable manufacturing overhead are calculated in the top section of the variable manufacturing overhead variance template. This data comes from the accounting records. Once the top section is complete, the amounts from the top section can be plugged into the formulas to compute the variable manufacturing overhead efficiency (quantity) and rate (price) variances. All standard cost variances are computed using the actual production quantity. The goal is to determine how much should have been incurred to produce the actual quantity of units produced and compare that to how much was actually incurred to produce the actual quantity of units produced.
The variable manufacturing overhead variances for NoTuggins are presented in Exhibit 8-10. Refer to the total variable manufacturing overhead variance in the top section of the template. Total standard quantity is calculated as standard quantity of the cost driver per unit times actual production, or 0.25 direct labor hours per unit times 150,000 units produced equals 37,500 direct labor hours. The standard variable manufacturing overhead rate per direct labor hour was established as $3. Total variable manufacturing overhead costs per the standard amounts allowed are calculated as the total standard quantity of 37,500 times the standard rate per hour of $3 equals $112,500. During the period, Brad projected he should pay $112,500 for variable manufacturing overhead to produce 150,000 units.
The total actual amounts incurred are reported on the next line. Actual amounts are pulled from the accounting records. During the period, 45,000 direct labor hours were worked to produce 150,000 units. The actual amount of variable manufacturing overhead incurred was $121,500. The actual overhead rate per hour is not given in the data presented in Exhibit 8-1. However, it can be calculated by taking the total price paid for variable manufacturing overhead and dividing it by the total number of hours worked, $121,500/45,000 = $2.70 actual rate per hour.
The total variances can be calculated in the last line of the top section of the template by subtracting the actual amounts from the standard amounts projected. The standard quantity allowed is 37,500 hours less the actual hours worked of 45,000 hours equals a variance of (7,500) direct labor hours. This variance is unfavorable because the actual hours worked exceed the standard hours allowed. The variable manufacturing overhead rate per hour variance is calculated as the projected standard variable manufacturing overhead rate of $3 per hour less the actual variable manufacturing overhead rate incurred of $2.70 equals a $0.30 favorable per hour rate variance. The overall rate variance is favorable since the actual rate incurred was lower than the standard rate allowed. The total variable manufacturing overhead variance is the total standard variable manufacturing overhead costs allowed of $112,500 less the actual amount paid for variable manufacturing overhead of $121,500 equals $(9,000) unfavorable. Brad spent $9,000 more on variable manufacturing overhead than he projected.
The completed top section of the template contains all the numbers needed to compute the variable manufacturing overhead efficiency (quantity) and rate (price) variances. Students do not need to refer to the dataset to get additional data. The variable manufacturing overhead efficiency and rate variances are used to determine if the overall variance is an efficiency issue, rate issue, or both.
Variable manufacturing overhead efficiency variance
The variable manufacturing overhead efficiency variance is calculated as the quantity difference times the standard overhead rate per hour. The quantity difference is (7,500) unfavorable. Since the difference is unfavorable, this variance will be unfavorable. The standard overhead rate per hour is $3. The variable manufacturing overhead efficiency variance is (7,500) U x $3 = $22,500 unfavorable.
Variable manufacturing overhead is applied based on direct labor hours. Since direct labor hours are the cost driver for variable manufacturing overhead in this example, the variance is linked to the direct labor hours worked in excess of the standard labor hours allowed. This overage in direct labor hours means that $22,500 of additional variable manufacturing overhead was incurred based on the standard amount applied per direct labor hour. Inefficient use of the cost driver used to apply variable manufacturing overhead typically results in additional overhead costs.
Variable manufacturing overhead rate variance
The variable manufacturing overhead rate variance is calculated as the overhead rate difference times the actual number of labor hours worked. The rate difference is $0.30 favorable. Since the difference is favorable, this variance will be favorable. The actual quantity is 45,000 direct labor hours. Actual quantity is used in this calculation to determine the overhead variance for the actual number of direct labor hours worked during the period. The variable manufacturing overhead rate variance is $0.30 F x 45,000 = $13,500 F.
The favorable manufacturing overhead rate difference indicates that the organization paid $13,500 less for variable manufacturing overhead than projected when you consider the difference in rate per hour over the actual number of hours worked. This variance should be investigated to determine if the savings will be ongoing or temporary.
Video Illustration 8-4: Computing variable manufacturing overhead variances
Using the standard and actual data given for Lastlock and the variable manufacturing overhead variance template, compute the variable manufacturing overhead variances.
Exhibit 8-11 Computing manufacturing overhead variances and video explanation
Check your understanding LO4
Standard costs variance analysis and evaluation
As demonstrated in this chapter, standard costs and variance analysis are tools used to project manufacturing product costs and evaluate production performance. Standard costs variance analysis is used to determine the variances between the standard amounts projected for manufacturing costs and the actual amounts incurred. It is important to remember that standards are the planned or projected amounts. Any variance between the standard amounts allowed and actual amounts incurred should be investigated.
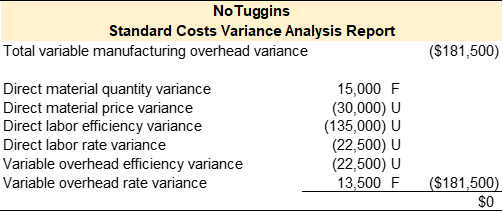
Refer to Exhibit 8-1. At the end of the current operating cycle, Brad determined that the actual variable manufacturing costs incurred to produce 150,000 units of NoTuggins were $181,500 more than the standard costs projected. A summary of the direct materials, direct labor, and variable manufacturing overhead variances is provided in Exhibit 8-12. This standard costs variance analysis report is the starting point for further investigation and corrective action if appropriate.
Exhibit 8-12 Standard costs variance analysis report for NoTuggins
Standard costs variance template
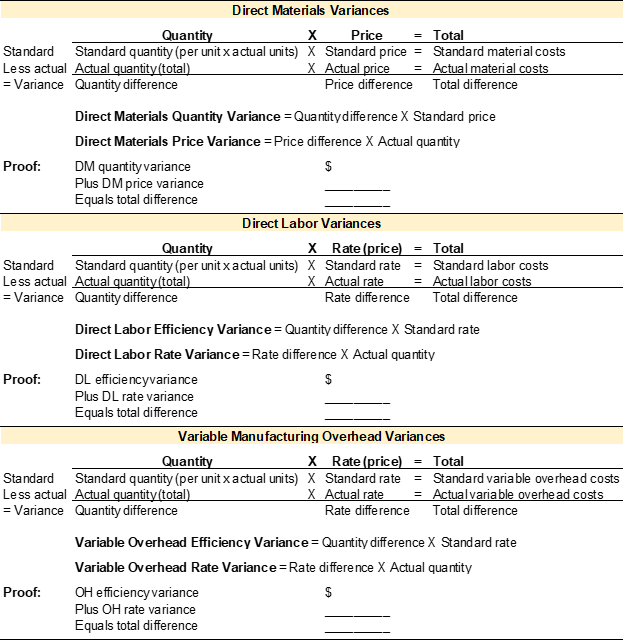
A template to compute the standard cost variances related to direct material, direct labor, and variable manufacturing overhead is presented in Exhibit 8-11.
Exhibit 8-13 Template to compute direct material, direct labor, and manufacturing overhead variances
Practice Video Problems
The chapter concepts are applied to comprehensive business scenarios in the below Practice Video Problems.
Practice Video Problem 8-1: Computing direct materials variances LO2
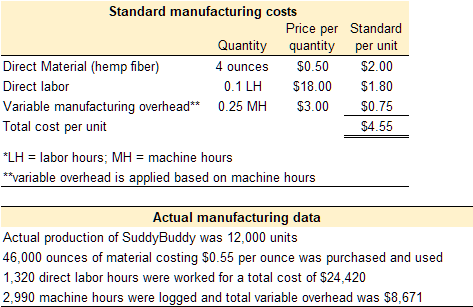
Kitchen Co. is experiencing production problems with SuddyBuddy, its most profitable product. Management has requested standard cost variances in order to isolate the issue. Standard and actual manufacturing cost data for SuddyBuddy are provided below.
Required 1: Prepare the total direct materials variance, direct materials quantity variance, and direct materials price variance.
Practice Video Problem 8-2: Computing direct labor variances LO3
Kitchen Co. is experiencing production problems with SuddyBuddy, its most profitable product. Management has requested standard cost variances in order to isolate the issue. Standard and actual manufacturing cost data for SuddyBuddy are provided below.
Required 1: Prepare the total direct labor variance, direct labor efficiency variance, and direct labor rate variance.
Practice Video Problem 8-3: Computing manufacturing overhead variances LO4
Kitchen Co. is experiencing production problems with SuddyBuddy, its most profitable product. Management has requested standard cost variances in order to isolate the issue. Standard and actual manufacturing cost data for SuddyBuddy are provided below.
Required 1: Prepare the total manufacturing overhead variance, manufacturing overhead efficiency variance, and manufacturing overhead rate variance.
Review Questions
Review questions reinforce the chapter content.
Review 8-1
Review 8-2
Review 8-3
Homework Questions
Homework questions can be used for additional practice or can be assigned in an academic setting. Full feedback is not available online. Homework questions can be assigned, with auto-grading and export, to specific learning management platforms, e.g., Canvas, Blackboard, etc. Contact the author for details.
Homework 8-1
Homework 8-2
Homework 8-3
Standards are cost or revenue targets used to make financial projections and evaluate performance.
A cost formula is used to predict the expected cost for a specific expenditure.
Standard costs are cost targets used to make financial projections and evaluate performance.
