
6 Budgeting

Learning Objectives LO
Purposes of budgeting LO1
Budgeting is a powerful tool that is widely used for planning, executing, and evaluating organizational operations. A budget is a detailed financial plan for future time periods. Budgets are typically prepared before the budgeted period begins. For this reason, budgeted amounts are estimates and not actual amounts. Most organizations use historical data and current operating plans to estimate budgeted amounts. In an established organization, an effective manager can make these estimates with remarkable accuracy. For example, if the lease payment is $2,000 per month it is easy to project in the upcoming budget that yearly rent expense will be $24,000. However, budgets are not static. Budgets are frequently revised during the period due to unforeseen circumstances such as a change in economic conditions, changes in sales demand, or other factors that affect the organization.
Budgets are used by organizations for planning, controlling, and evaluating performance.
Planning. The budget is created prior to the time period covered by the budget. The completed budget is then used by management to help plan operations including activities like scheduling production, purchasing materials, and making capital investments.
Controlling. The budget is used to control operations during the time period covered by the budget. It sets forth expected targets and limitations. The budget projects sales and revenue targets, production targets, and spending limitations for budgeted expenditures. For example, the budgets establishes the amount to be spent on raw materials; direct labor; and selling, general, and administrative expenses. It is the responsibility of management to ensure that actual expenditures are within the budgetary guidelines.
Performance evaluation. The budget is also used to evaluate the actual results achieved during the time period covered by the budget. Performance evaluation involves comparing the actual results to the results projected in the budget. Comparing budgeted activities to actual results is a widely used method for performance evaluation at all levels of the organization. For example, management can evaluate various departments or activities to see if they met expected targets or stayed within budgeted spending limitations. This feedback can be used to correct organizational inefficiencies or in some cases to justify adjusting budgeting projections and assumptions going forward.
Check your understanding LO1
Master budget LO2
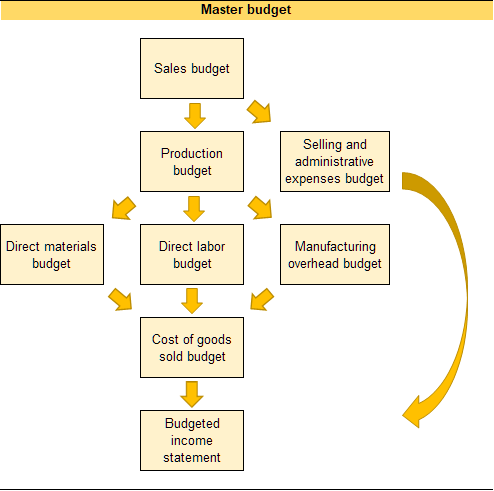
An organization’s collection of budgets is known as the master budget. An organization’s master budget consists of a set of interrelated but independent budgets that articulate the organization’s sales, production, profit, and financial position for a specified time period. A master budget is a tool used by management to effectively plan, control, and evaluate business operations.
A flowchart showing significant independent budgets included in the master budget for a manufacturing organization, and how these individual budgets interrelate is provided in Exhibit 6-1.
As demonstrated in Exhibit 6-1, the budgets are interrelated with some budgets feeding into other budgets. For this reason, budgets must be completed in a specific order. The sales budget is the first budget completed in the master budget. The estimated sales number drives many organizational decisions such as how many units to produce, how many people to employ, and what kind of facilities are necessary to support that level of sales activity.
Exhibit 6-1 Relationship between individual budgets within a master budget
Check your understanding LO2
Sales budget LO3
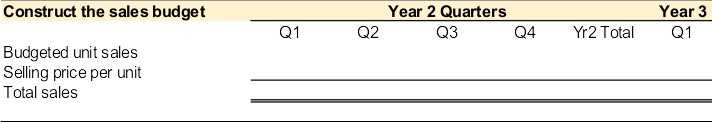
The sales budget is the first budget prepared in the master budget. Estimated sales is the basis for the individual budgets within the master budget. Estimating sales is a fundamental part of the budgeting process. Estimated sales are used to project everything else, such as sales revenue collected, production needs, and organizational expenditures.
The example of Wonderball, Inc. is used to illustrate the individual budgets. The Wonderball is a unique stress ball made from crushed crystals. Due to innovative social media marketing, Wonderball is trending on nearly every social media platform. Sofia, the creator and owner of Wonderball, Inc. is preparing a master budget for her second year of operations. Sofia decided to prepare the master budget by quarter.
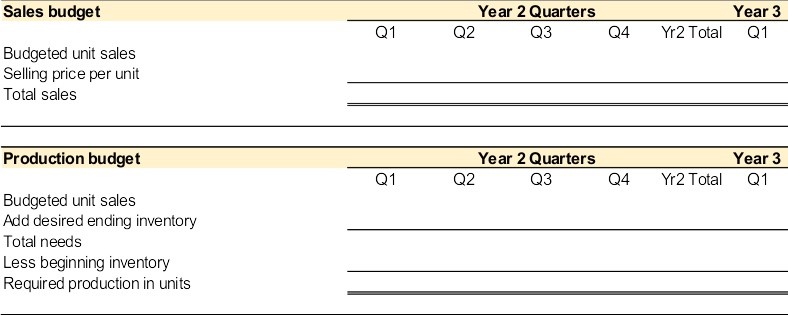
The first budget she needs to prepare is the sales budget. The sales budget is provided in Exhibit 6-2. First, Sophia estimated the number of units she believes the company will sell in the upcoming period. She looked at past sales data to project the number of units sold in each quarter. She projects a sharp increase in sales in quarter 4 (Q4) due to holiday gift-giving. Each unit sells for $15. The sales budget is calculated by multiplying the budgeted units in sales by the selling price per unit to get total sales dollars. Total sales dollars for her second year of operations is estimated to be $3,915,000.
Exhibit 6-2 Sales budget for Wonderball, Inc.

Video Illustration 6-1: Preparing the sales budget
Stephanie Shuck invented a revolutionary new product called the Water Wiz. The Water Wiz can be programmed to deliver the perfect amount of water and nutrients to virtually any type of potted plant. The company experienced a profitable first year of operations. In the final quarter of the first year, Stephanie decided to compile a master budget to plan for the second year of operations.
For this illustration, assume that Stephanie only sells one product, the Water Wiz. The Water Wiz sells for $20 per unit. For the upcoming year, she expects to sell 20,000 units in the first quarter, 24,000 units in the second quarter, 33,000 units in the third quarter, and 40,000 units in the fourth quarter. In the first quarter of year 3, she expects to sell 21,000 units. Prepare the sales budget.
Exhibit 6-3 Constructing a sales budget video explanation
Check your understanding LO3
Production budget LO4
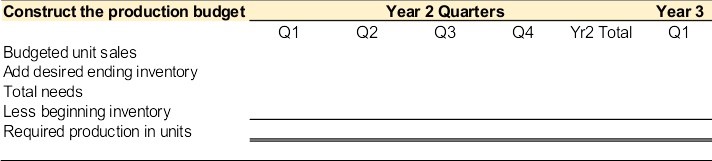
The production budget is prepared after the sales budget. The production budget estimates the number of units that need to be produced to meet sales demand and to maintain a desired level of finished goods inventory on hand. Normally making and storing a large quantity of excess inventory is not recommended. However, producing a small amount of excess inventory or a desired level of ending finished goods inventory is standard practice. The excess inventory serves as a buffer in case sales demand is more than expected, production issues occur, or the organization needs additional inventory for another reason. Maintaining a small amount of excess inventory is preferable to running out of inventory.
The production budget for Wonderball, Inc. is provided in Exhibit 6-4 below. The production budget starts with budgeted units in sales taken from the sales budget. Sofia needs to produce the units she intends to sell each quarter. Also, she would like to produce additional units to have on hand. Specifically, she wants to produce a desired ending finished goods inventory in the current quarter equal to 20% of the next quarter’s budgeted units in sales. Sofia began the first quarter of year 2 with 11,400 units in the beginning finished goods inventory account. This beginning inventory was carried forward from quarter 4 of year 1. The 11,400 was the desired ending inventory that she produced in quarter 4 of year 1. Since the ending inventory from one quarter becomes the beginning inventory in the next quarter, the company will start each quarter with 20% of the current quarter’s budgeted sales on hand. In the first quarter of year 3, the desired ending finished goods inventory is projected to be 12,700 units.
The formula for calculating the production budget is budgeted units in sales plus desired ending inventory (20% of the next quarter’s budgeted units of sales in this case) equals total production needs. For quarter 1, the desired ending inventory is 20% of the budgeted units in sales for quarter 2, or 63,000 units x 20% = 12,600 units. For each quarter, we only need to produce some of the total production needs since we carried forward additional units from the last quarter. The desired ending inventory from one quarter becomes the beginning inventory in the next quarter. The beginning inventory for quarter 1 is given above as 11,400 units carried forward from Q4 of year 1. The ending inventory for quarter 1 (12,600) then becomes the beginning inventory for quarter 2. The beginning inventory carried forward from the previous quarter is subtracted from total production needs to arrive at required production in units for the current quarter.
Exhibit 6-4 Production budget for Wonderball, Inc.

Video Illustration 6-2: Preparing the production budget
Stephanie wants to maintain a desired ending finished goods inventory in the current quarter equal to 10% of the next quarter’s production. Stephanie began the first quarter of year 2 with 2,000 units of Water Wiz in the beginning finished goods inventory account. In the first quarter of year 3, the desired ending finished goods inventory is projected to be 2,700 units. Prepare the production budget.
Exhibit 6-5 Constructing a production budget video explanation
Check your understanding LO4
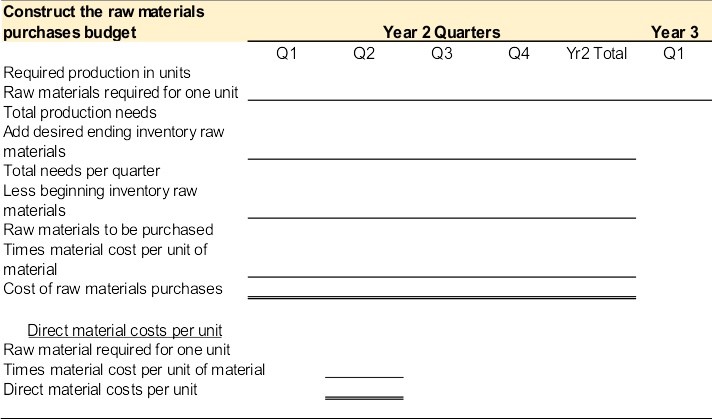
Direct materials purchases budget LO5
After the production budget is completed, the direct materials purchases budget is prepared. The direct materials purchases budget estimates the amount of direct raw materials purchases needed to produce the units scheduled for production plus the desired level of raw materials ending inventory. Purchasing a small quantity of excess raw materials, referred to as the desired amount of ending raw materials inventory, acts as a buffer in case additional raw materials are needed due to unexpected supply chain issues, production issues, or sales demand.
It is common to use several different direct materials to produce a final product in a manufacturing environment. A direct materials budget is prepared for each direct material used. For example, the production of a student desk may require three direct materials–wood, hardware, and stain. A separate raw materials budget is created for each of these materials. It is also common for the quantity of raw material used to produce one unit of product to be more or less than one unit of the raw material. In the student desk example, each desk may require 12 feet of wood board. The quantity of wood needed to produce one desk is 12 feet, two desks 24 feet, and three desks 36 feet.
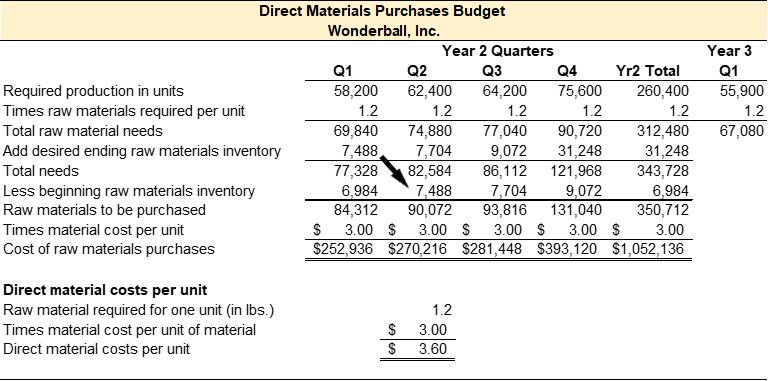
Continuing with the Wonderball, Inc. example, the direct materials purchases budget is prepared after the production budget. Finely crushed quartz crystal is the only direct material used to produce the Wonderball. The crushed crystal is poured into a specialized machine with a small amount of proprietary chemical additives. The chemical additives are accounted for as indirect materials or manufacturing overhead. The crushed crystal mixture is pressurized, causing the particles to form a bond. Each unit requires 1.2 pounds of crushed crystal. The crushed crystal costs $3.00 per pound.
The direct materials purchases budget for Wonderball, Inc. is provided in Exhibit 6-6 below. The direct materials purchases budget starts with the required production in units taken from the production budget. Sofia must purchase the materials required for each quarter’s production needs. Also, she would like to purchase additional raw materials to have on hand. Specifically, she wants to maintain a desired ending raw materials inventory in the current quarter equal to 10% of the next quarter’s total raw materials needs. The ending inventory in one quarter becomes the beginning inventory in the next quarter. Sofia began the first quarter of year 2 with 6,984 pounds of raw materials in the beginning raw materials inventory account. The desired ending raw materials inventory purchased in quarter 4 of year 1 is carried forward as the beginning raw materials inventory for quarter 1 of year 2.
The formula for calculating the costs for direct materials starts by taking the required production in units (from the production budget) times raw materials required per unit to get the total raw materials needs. Each unit of Wonderball requires 1.2 pounds of crushed crystal. Raw materials needs plus the desired ending inventory (10% of the next quarter’s total raw materials needs in this case) equals total needs. For quarter 1, the desired ending raw materials inventory is 10% of the total needs of quarter 2, or 74,880 pounds x 10% = 7,488. We only need to purchase some of the total raw material needs since we carried forward raw materials inventory from the last quarter. The desired ending inventory from one quarter becomes the beginning inventory in the next quarter. The beginning inventory carried forward from the previous quarter is subtracted from the total needs to arrive at raw materials that need to be purchased. This amount is multiplied by the cost per unit of material to get the cost of raw materials purchases. The direct materials costs per unit are calculated at the bottom of the raw materials purchases budget.
Exhibit 6-6 Direct materials purchases budget for Wonderball, Inc.
Video Illustration 6-3: Preparing the direct materials purchases budget
Assume that Stephanie wants to maintain a desired ending raw materials inventory in the current quarter equal to 20% of the next quarter’s production. The only raw material used to produce a single unit is the 3 pounds of eco-friendly, biodegradable composite material. The composite material costs $1.00 per pound. Stephanie began the first quarter of year 2 with 12,240 pounds in the beginning raw material inventory account. Prepare the direct material purchases budget.
Exhibit 6-7 Constructing a direct materials purchases budget video explanation
Check your understanding LO5
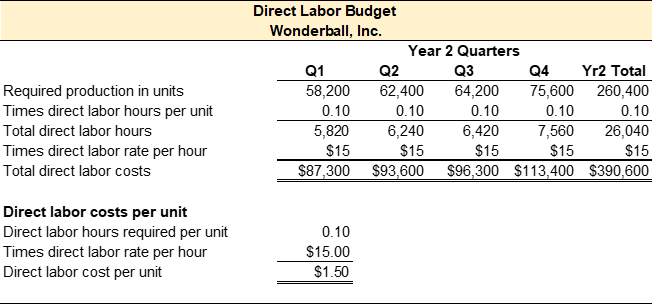
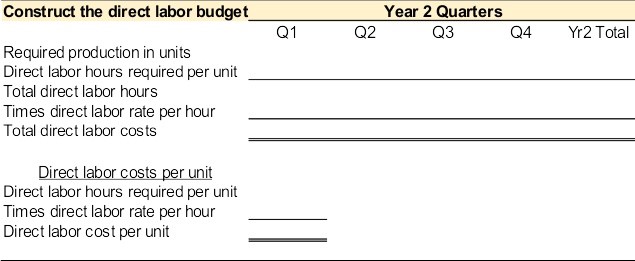
Direct labor budget LO6
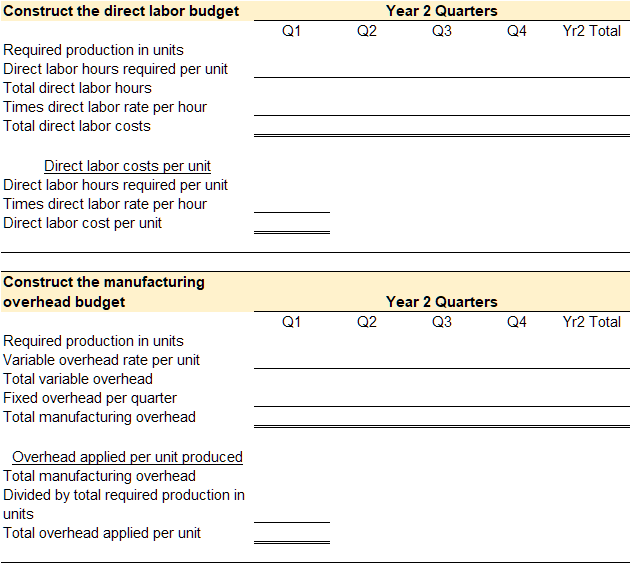
After the production budget is prepared the direct labor budget is prepared. The direct labor budget calculates the total number of labor hours and the total cost of direct labor needed to satisfy production.
It is common for the number of direct labor hours needed to produce one unit to be more or less than one hour of direct labor. Continuing with the Wonderball, Inc. example, assume that a worker can load and process one Wonderball every 6 minutes. The direct labor hours needed to produce a single unit is 0.10 of an hour (6 minutes / 60 minutes in an hour). The worker is paid $15 per hour.
The direct labor budget for Wonderball, Inc. is provided in Exhibit 6-8 below. The direct labor budget starts with the required production in units taken from the production budget. The formula for calculating the costs of direct labor starts by taking the required production in units (from the production budget) times direct labor hours required to complete one unit to get the total number of direct labor hours required. Next, take total direct labor hours times the direct labor rate per hour to get total direct labor costs. The direct labor costs per unit is calculated at the bottom of the direct labor budget.
Exhibit 6-8 Direct labor budget for Wonderball, Inc.
Video Illustration 6-4: Preparing the direct labor budget
Assume that each unit of Water Wiz requires 0.25 direct labor hours to complete. The average direct labor rate is $15 per hour. Prepare the direct labor budget.
Exhibit 6-9 Constructing a direct labor budget video explanation
Check your understanding LO6
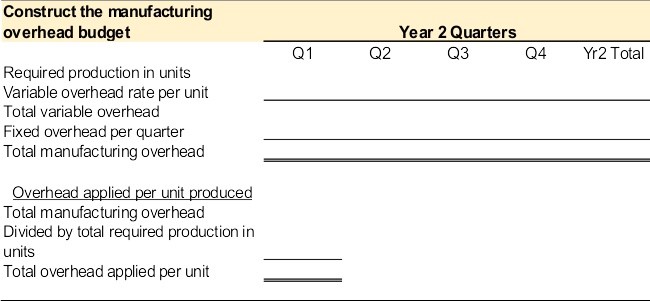
Manufacturing overhead budget LO7
The final budget to determine product costs is the manufacturing overhead budget. The manufacturing overhead budget calculates the total manufacturing overhead that will be incurred to satisfy production needs.
Manufacturing overhead includes indirect materials used in production, such as glue, screws, and nails; indirect labor used in production, such as wages for the production supervisor or quality control; and all other costs incurred to manufacture a product, such as rent, insurance, taxes, and utilities incurred on the manufacturing facilities.
Manufacturing overhead is classified as variable or fixed. Variable manufacturing overhead costs are the same per unit, but total costs depend on the quantity produced. Fixed manufacturing overhead costs are the same in total regardless of the quantity produced.
After carefully classifying all indirect product costs as variable, fixed, or mixed, Sophia determined that each unit of Wonderball consumes $0.12 of variable manufacturing overhead and total fixed manufacturing overhead is $21,500. The manufacturing overhead budget is presented in Exhibit 6-10.
Exhibit 6-10 Manufacturing overhead budget for Wonderball, Inc.

Video Illustration 6-5: Preparing the manufacturing overhead budget
Assume that each units of Water Wiz requires $0.10 of variable manufacturing overhead per unit produced and total fixed manufacturing overhead is $41,000 per quarter.
Exhibit 6-11 Constructing a manufacturing overhead budget video explanation
Check your understanding LO7
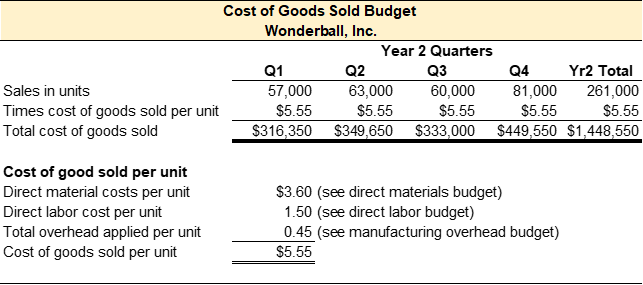
Cost of goods sold budget LO8
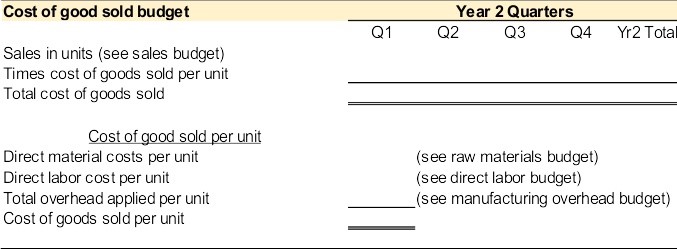
The cost of goods sold budget is prepared after the raw materials budget, direct labor budget, and manufacturing overhead budgets are prepared. The cost of goods sold budget determines the estimated cost for the inventory sold during the period. Cost of goods sold is the total manufacturing costs, or product costs, incurred to make the products that were sold. Product costs include the costs for direct material, direct labor, and manufacturing overhead.
Cost of goods sold per unit is the sum of direct materials per unit, direct labor per unit, and manufacturing overhead per unit. These numbers are taken from the direct materials budget, direct labor budget, and manufacturing overhead budget. The estimated number of sales in units is taken from the sales budget. The cost of goods sold budget for Wonderball, Inc. is provided in Exhibit 6-12.
Exhibit 6-12 Cost of goods sold budget for Wonderball, Inc.
Video Illustration 6-6: Preparing the cost of goods sold budget
The cost of goods sold budget for Water Wiz is presented in Exhibit 6-13 below. Prepare the cost of goods sold budget using data from the sales budget, raw material budget, and manufacturing overhead budget.
Exhibit 6-13 Constructing a cost of goods sold budget video explanation
Check your understanding LO8
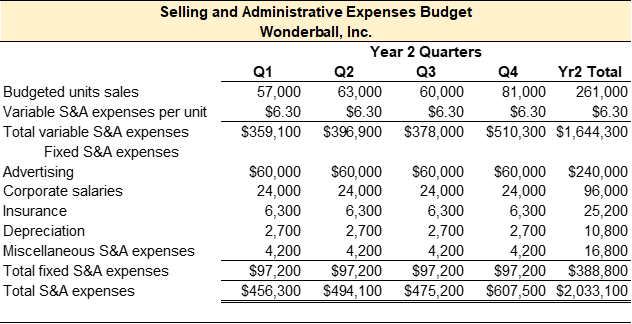
Selling and administrative expenses budget LO9
The selling and administrative expenses budget must be prepared before a budgeted income statement can be prepared. Selling and administrative expenses (S&A expenses) are classified as period costs, or any cost not necessary to manufacture the product. Product costs-direct material, direct labor, and manufacturing overhead-are included in the cost of goods sold budget. All costs that are not product costs are considered period costs. Although period costs are not necessary to produce the product, they are necessary to sustain the organization.
Selling and administrative expenses are typically classified as variable or fixed. After carefully classifying all selling and administrative costs as variable, fixed, or mixed, Sophia determined that each unit of Wonderball incurred $6.30 variable selling and administrative costs and fixed selling and admisntrative costs per quarter totaled $97,200. The selling and administrative expenses budget is presented in Exhibit 6-14.
Exhibit 6-14 Selling and administrative expenses budget for Wonderball, Inc.
Video Illustration 6-7: Preparing the selling and administrative expenses (S&A expenses) budget
Assume that Stephanie projects the following selling and administrative expenses: variable S&A expenses $6.20 per unit; advertising $25,000 per quarter; corporate salaries $60,000 per quarter; insurance $12,000 per quarter; property taxes $1,000 per quarter; depreciation $21,000 per quarter; miscellaneous S&A expenses $9,000 per quarter.
Exhibit 6-15 Constructing a selling and administrative budget video explanation
Check your understanding LO9
Budgeted income statement LO10
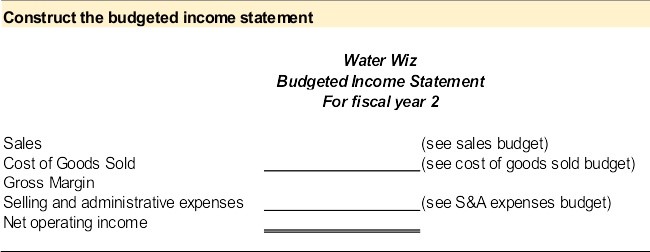
After all the other budgets are prepared, budgeted financial statements can be prepared. Standard financial statements include the income statement, balance sheet, and statement of cash flows. The income statement reports the organization’s profitability during a specific period. The balance sheet reports the organization’s financial position at a single point in time. The statement of cash flows reports an organization’s cash inflows and outflows during a specific period. The focus of this section is the budgeted income statement.
As mentioned above, the budgeted income statement reports the organization’s profitability. Since budgets are typically prepared prior to the budgeted period, the budgeted income statement can be used to forecast profits for the upcoming period. The income statement for a manufacturing organization is sales less cost of goods sold equals gross margin. Selling and administrative expenses are subtracted from the gross margin to arrive at net operating income. Data to completed the budgeted income statement is taken from the sales budget, cost of goods sold budget, and selling and administrative expenses budget. The budgeted income statement for Wonderball, Inc. is provided in Exhibit 6-16.
Exhibit 6-16 Budgeted income statement for Wonderball, Inc.

Video Illustration 6-8: Preparing the budgeted income statement
Use the data provided in the sales budget, cost of goods sold budget, and selling and administrative expenses budget to prepare the budgeted income statement.
Exhibit 6-17 Constructing budgeted income statement video explanation
Check your understanding LO10
Practice Video Problems
The chapter concepts are applied to comprehensive business scenarios in the below Practice Video Problems.
Practice Video Problem 6-1: Sales and production budgets
Alli Oop produces and sells pink basketballs for professional players and charity events. The company is entering its second year of operations. The company projects the following sales in units for the upcoming fiscal year: 8,000 units Q1; 9,300 units Q2; 6,000 units Q3; 5,000 units Q4; and 9,000 units in quarter 1 of year 3. The basketballs sell for $18 per unit.
Alli Oop wants to maintain a desired ending finished goods inventory in the current quarter equal to 20% of the next quarter’s production. The company began the first quarter of year 2 with 1,600 basketballs in the beginning finished goods inventory. In the first quarter of year 3, the desired ending finished goods inventory is projected to be 1,200 basketballs.
Required 1: Prepare the sales and production budgets
Practice Video Problem 6-2 Part 1: Budgets to determine product costs and cost of goods sold
Alli Oop produces and sells pink basketballs for professional players and charity events. The company is entering its second year of operations. The company’s production budget reported the following production in units for the upcoming fiscal year: 8,260 units Q1; 8,640 units Q2; 5,800 units Q3; 5,800 units Q4; and 8,400 units in quarter 1 of year 3.
Each basketball requires 2 pounds of rubber material at a cost of $1.50 per pound. Alli Oop wants to maintain a desired ending raw materials inventory in the current quarter equal to 10% of the next quarter’s production. The company began the first quarter of year 2 with 1,652 pounds of raw material in beginning inventory.
Required 1: Prepare the raw materials purchases budget
Practice Video Problem 6-2 Part 2: Budgets to determine product costs and cost of goods sold
Alli Oop produces and sells pink basketballs for professional players and charity events. The company is entering its second year of operations. The company’s production budget reported the following production in units for the upcoming fiscal year: 8,260 units Q1; 8,640 units Q2; 5,800 units Q3; 5,800 units Q4; and 8,400 units in quarter 1 of year 3.
Each basketball requires .10 direct labor hours to produce. The average pay rate for direct labor is $18 per hour. Manufacturing overhead is projected to be $0.50 per unit variable and fixed overhead $45,000 per quarter.
Required 2: Prepare the direct labor budget and manufacturing overhead budget
Practice Video Problem 6-2 Part 3: Budgets to determine product costs and cost of goods sold
Alli Oop produces and sells pink basketballs for professional players and charity events. The company is entering its second year of operations. The company projects the following sales in units for the upcoming fiscal year: 8,000 units Q1; 9,300 units Q2; 6,000 units Q3; 5,000 units Q4; and 9,000 units in quarter 1 of year 3. The basketballs sell for $18 per unit.
Required 3: Prepare the cost of goods sold budget
Practice Video Problem 6-3: Budgeted income statement
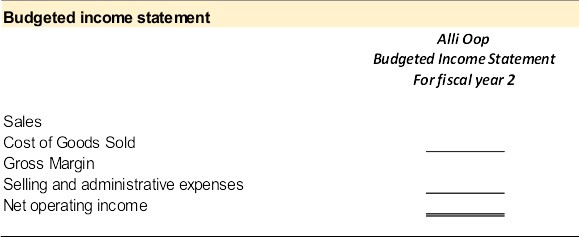
Alli Oop produces and sells pink basketballs for professional players and charity events. The company is entering its second year of operations. The sales budget reported 28,300 in total sales in units for year 2. Each basketball sells for $18 per unit. Total sales dollars is $509,400. The cost of goods sold budget reported the total cost of goods sold of $328,727. The selling and administrative budget reported total selling and administrative expenses as $150,900.
Required 1: Prepare the budgeted income statement for fiscal year 2
Review Questions
Review questions reinforce the chapter content.
Review 6-1
Review 6-2
Review 6-3
Homework Questions
Homework questions can be used for additional practice or can be assigned in an academic setting. Full feedback is not available online. Homework questions can be assigned, with auto-grading and export, to specific learning management platforms, e.g., Canvas, Blackboard, etc. Contact the author for details.
Homework 6-1
Homework 6-2
Homework 6-3
Homework 6-4
Homework 6-5
Homework 6-6
Homework 6-6
Homework 6-7
A detailed financial plan for future time periods.
A master budget consists of a set of interrelated but independent budgets that articulate the organization’s sales, production, profit, and financial position for a specified time period.
The sales budget details the estimated sales quantity, sales price per unit, and total sales revenue.
The production budget estimates the number of units that need to be produced to 1) meet sales demand and 2) maintain the desired level of finished goods inventory on hand.
The direct materials purchases budget estimates the amount of raw materials purchases needed to produce the units scheduled for production plus the desired level of raw materials ending inventory.
Product costs are all costs associated with purchasing or producing inventory for resale.
The manufacturing overhead budget calculates the total manufacturing overhead that will be incurred to satisfy production.
Indirect materials are raw materials that cannot be easily and economically traced to the production of the product, e.g. glue, nails, sandpaper, towels, etc.
Indirect labor costs are manufacturing labor costs that cannot be easily and economically traced to the production of the product, e.g. the production supervisor’s salary or quality control.
Variable costs are the same cost per unit but the total cost depends on the quantity produced, used, or sold.
Fixed cost is the same cost in total regardless of the quantity produced, used, or sold but the per-unit cost changes depending on the quantity produced, used, or sold.
Cost of Goods Sold is the expense account used to report the costs associated with purchasing or manufacturing the inventory sold.
Direct materials are raw materials costs that can be easily and economically traced to the production of the product.
Direct labor is manufacturing labor costs that can be easily and economically traced to the production of the product.
Manufacturing overhead are all other indirect costs associated with manufacturing the product that are not direct material or direct labor.
Budget used to project selling and administrative expenses (S&A expenses) or period expenses.
The budgeted income statement reports the organization's profitability during a specific period.
