
4 Cost Volume Profit (CVP) Analysis

Learning Objectives LO
LO1 Identify the purposes of cost volume profit analysis
LO2 Explain how the contribution margin income statement is used for cost volume profit analysis
LO3 Apply cost volume profit analysis to show the effects on net operating income from changes in variable costs, fixed costs, selling price, and sales volume
LO4 Calculate the breakeven point in sales dollars and units sold
LO5 Calculate target profit in sales dollars and units sold
Purposes of cost volume profit (CVP) analysis LO1
Cost volume profit (CVP) analysis helps managers make many important decisions about what products and services to offer, what prices to charge, what marketing strategy to use, and what cost structure to maintain. Cost structure is the type and proportion of fixed and variable costs in relation to the organization’s total costs. The primary purpose of cost volume profit analysis is to estimate how profits are affected by the following five factors:
-
- Selling prices
- Sales volume
- Unit variable costs
- Total fixed costs
- Mix of products sold
Check Your Understanding LO1
CVP analysis using the contribution margin income statement LO2
Cost volume profit (CVP) analysis is based on cost behavior. Cost behavior is how a cost reacts to changes in production or sales quantity. Cost behavior is discussed in detail in Chapter 1. To recap, cost behavior is classified as variable, fixed, or mixed.
Variable cost—cost is the same per unit but the total changes depending on quantity
Fixed cost—cost is the same in total regardless of quantity but the per unit cost changes depending on quantity
Mixed cost—cost has both a variable and a fixed component
Cost behavior must be considered to estimate how profits are affected by changes in sales prices, sales volume, unit variable costs, total fixed costs, and the mix of products sold. The contribution margin income statement classifies costs on the basis of cost behavior. For this reason, it is an essential tool for cost volume profit analysis. The contribution margin income statement is covered in detail in Chapter 1. In this chapter, cost volume profit analysis using the contribution margin income statement is introduced.
Video Illustration 4-1: Discussion of CVP and the contribution margin income statement LOs1,2
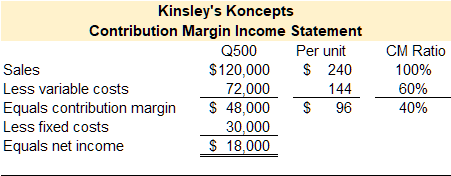
Kinsley Shuck, the founder of Kinsley’s Koncepts, designed a radical new toy that can be programmed to perform various tasks. The programmable toy was an immediate success, and sales grew to the point that Kinsley moved the company’s headquarters out of her garage and into a rented manufacturing space. Kinsley sold 500 toys in the first year of operation. The contribution margin income statement for Kinsley’s Koncepts first year of operations is presented in Exhibit 4-1.
Exhibit 4-1 Contribution margin income statement and video explanation
CVP analysis when sales quantity changes LO3
The contribution margin represents the margin that an organization can make or lose as the number of units sold increases or decreases. The most common error in calculating the effect of changes in sales quantity on net operating income is using the sales price instead of the contribution margin. To illustrate, refer to the data for Kinsley’s Concepts presented in Exhibit 4-1. How much would net operating income change if Kinsley sold one more unit? A common mistake is to assume that net income would increase by the sales price or $240. However, this is incorrect. If Kinsley sells one more unit, she will gain $240 in sales revenue and incur $144 of variable expenses. Sales revenue and variable expenses are both variable, meaning the per unit is the same, but the total changes in relation to the quantity sold. Therefore, net income would increase by $96, the current contribution margin.
The effect of changes in sales quantity on net income can also be calculated using the contribution margin ratio. The contribution margin ratio represents the percentage of gross margin an organization can make or lose as the number of units sold increases or decreases. The contribution margin ratio stays the same when the sales quantity changes. Refer to the data in Exhibit 4-1. The contribution margin ratio for Kinsley’s Koncepts is 40%. For every dollar of sales, 60% will be used to cover variable expenses, and 40% will be left to increase the contribution margin. If Kinsley sells one more unit, she will gain $240 in sales revenue. The contribution margin ratio can be used to calculate the additional variable expenses she will incur as $240 x 60% = $144. The additional contribution margin can be calculated as $240 x 40% = $96.
Fixed costs are not affected by changes in sales quantity within an organization’s relevant range of production. For example, refer to Exhibit 4-1. Kinsley’s Koncepts reported fixed expenses of $30,000. Assume that $2,000 is the monthly rent on her new manufacturing space. The rental contract fixes the rent amount. The landlord will not increase or decrease the monthly rent based on how many units Kinsley sells or produces in the space. Accordingly, fixed costs do not change when sales quantity changes.
If Kinsley sells one more unit, the contribution margin will increase by $96. Fixed costs will be unaffected ($30,000). Net operating income will increase to $18,000 + 96 = $18,096.
If Kinsey sells 100 more units, the contribution margin will increase by 100 x $96 = $9,600. Fixed costs will be unaffected ($30,000). Net operating income will increase to $18,000 + 9,600 = $27,600.
If sales decrease by 50 units, the contribution margin will decrease by 50 x $96 = $4,800. Fixed costs will be unaffected ($30,000). Net operating income will decrease to $18,000 – 4,800 = $13,200.
Video Illustration 4-2: Using CVP to forecast changes in contribution margin and net operating income from an increase in sale quantity LO3
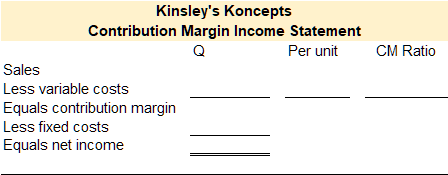
Kinsley’s Koncepts is currently selling 500 toys per year. The contribution margin income statement for Kinsley’s Koncepts first year of operations is presented in Exhibit 4-2. Assume sales increase from 500 toys to 550 toys.
Exhibit 4-2 Contribution margin income statement and video explanation
Check Your Understanding LO3
CVP analysis and changes on net operating income LO3
Cost volume profit analysis can be used to analyze the effect on net operating income from changes in fixed costs, also considered a change in the cost structure. Cost structure is the type and proportion of fixed and variable costs related to the organization’s total costs.
Managers, owners, or accountants use cost volume profit (CVP) analysis to estimate how profits are affected by changes in sales quantity, sales price, variable costs, fixed costs, and sales mix. The overall effect of changes in sales quantity, sales price, variable costs, and fixed costs are discussed below. The effects of these changes are calculated in Video Illustration 4-3, Video Illustration 4-4, and Video Illustration 4-5.
Changes in sales quantity
As demonstrated in Video Illustration 4-2 in the preceding section, cost volume profit analysis can be used to analyze the effect on net operating income from changes in sales quantity. A change in sales quantity does not change the per unit amounts for revenue, variable costs, or contribution margin. The contribution margin ratio will not change. However, a change in sales quantity will change the total amounts for total sales dollars, total variable costs, and total contribution margin. Fixed costs are not affected by a change in sales quantity. Since total contribution margin is changed, net operating income will also change.
Changes in sales price
Cost volume profit analysis can be used to analyze the effect on net operating income from changes in sales price. A change in sales price is a per unit change, so it affects the per unit amounts on the contribution margin income statement. Contribution margin is sales less variable costs. When sales price changes, per unit variable costs remain the same, but per unit contribution margin changes. This change also affects the total amount for sales dollars, variable costs, and contribution margin. The new total amount is calculated as the new per unit amounts times the sales quantity. Fixed costs are not affected by a change in sales quantity. Since total contribution margin is changed, net operating income will also change.
Changes in variable costs
Cost volume profit analysis can be used to analyze the effect on net operating income from changes in variable costs, also considered a change in cost structure. A change in variable cost is a per unit change, so it affects the per unit amounts on the contribution margin income statement. When variable cost changes, per unit sales price remains the same, but the per unit contribution margin changes. The total amount for sales dollars, variable costs, and contribution margin are also changed. The new total amount is calculated as the new per unit amounts times the sales quantity. Fixed costs are not affected by a change in variable costs. Since total contribution margin is changed, net operating income will also change.
Changes in fixed costs
Cost volume profit analysis can be used to analyze the effect on net operating income from changes in fixed costs, also considered a change in the cost structure. Changes in fixed costs do not affect sales quantity, sales revenue, variable costs, or contribution margin. A change in fixed cost affects net operating income.
Video Illustration 4-3: Using CVP to show the effects on net operating income from changes in fixed costs and sales quantity LO3
Kinsley’s Koncepts is currently selling 500 toys per year. A contribution margin income statement is presented in Exhibit 4-3. Kinsley’s Koncepts reported the following contribution margin income statement for their first year of operations. The sales manager feels that a $6,000 increase in the advertising budget would increase sales by $9,600 to a total of 540 units. Should the advertising budget be increased?
Exhibit 4-3 Contribution margin income statement and video explanation
Video Illustration 4-4: Using CVP to show the effects on net operating income from changes in variable costs Lo3
Refer to the original in Exhibit 4-4. Kinsley’s Koncepts is currently selling 500 toys per year. Kinsley’s Koncepts reported the following contribution margin income statement for their first year of operations. Kinsley is considering the use of higher-quality components, which would increase variable costs (and thereby reduce the contribution margin) by $6 per toy. However, the sales manager predicts that using higher-quality components would increase sales to 550 toys per year. Should the higher-quality components be used?
Exhibit 4-4 Contribution margin income statement and video explanation
Video Illustration 4-5: Using CVP analysis to show the effects on net operating income from changes in sales price and fixed costs LO3
Refer to the original data in Exhibit 4-5. Kinsley’s Koncepts is currently selling 500 toys per year. Kinsley’s Koncepts reported the following contribution margin income statement for their first year of operations. To increase sales, the sales manager would like to cut the selling price by $40 per toy and increase the advertising budget by $15,000 per year. The sales manager believes that if these two steps are taken, unit sales will increase by 200 toys per year. Should the changes be made?
Exhibit 4-5 Contribution margin income statement and video explanation
Break even point and target profit LOs 4,5
The contribution margin income statement can be used to compute break even and target profit. Break even is the point at which net operating income equals zero. Or, an organization breaks even when its sales revenue covers total costs–both variable and fixed. Break even is an important calculation, especially in new or start-up organizations. An organization should know how many units it needs to sell in order to cover its costs. In fact, most business plans and start-up business financing requests require the break even calculation to be reported. For example, an organization might discover they need to sell 10,000 units to break even when the demand for the product is only 2,000 units. In this case, the company cannot break even given current expenses and sales demand so they should not produce the product or they need to reduce costs.
Target profit is the point at which net operating income equals a specified amount. The calculation for target profit is closely related to break even. Target profit is calculated when an organization needs to know the quantity of sales required to cover total costs and earn a certain net profit.
The formulas to compute break even and target profit are provided in Exhibit 4-6.
Exhibit 4-6 Break even and target profit formulas

*Contribution margin per unit or CM per unit (Sales price per unit – variable costs per unit)
*Contribution margin ratio or CM ratio (contribution margin in dollars/sales revenue in dollars)
Video Illustration 4-6: Calculating breakeven and target profit LOs4,5
A contribution margin income statement for Kinsley’s Koncepts is provided in Exhibit 4-5. Use this data to compute break even in units and sales dollars.
Exhibit 4-5 Contribution margin income statement and video explanation
Compute the breakeven in units sold and sales dollars for Kinsley’s Koncepts.
Break even in units sold
Break even in sales dollars
Assume that Kinsley’s Koncepts wants to earn a target profit of $10,000. Compute the number of sales required in units and sales dollars.
Target profit in units sold
Target profit in sales dollars
Check Your Understanding LO4,5
Practice Video Problems
The chapter concepts are applied to comprehensive business scenarios in the below Practice Video Problems.
Practice Video Problem 4-1 Part 1: Calculating break even and target profit, LOs4,6
Sweet Eats reported the following contribution margin income statement for their first year of operations.
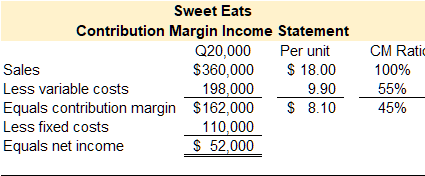
Required 1: Compute the break even in both sales units and sales dollars for Sweet Eats.
Break even in units sold
Break even in sales dollars
Required 2: Compute target profit in both sales units and sales dollars assuming that Sweet Eats is projecting $75,000 in net income.
Target profit in units sold
Target profit in sales dollars
Practice Video Problem 4-1 Part 2: Cost volume profit (CVP) analysis change in sales quantity, sales price, and fixed expenses LO2,3
Sweet Eats is currently selling 20,000 treats per year. A contribution margin income statement for the first year of operations is provided below. Compute net income assuming the selling price decreases by $1.50 per unit, fixed expenses increase by $10,000, and the number of units sold decreases by 5%.
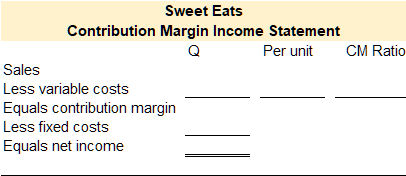
Practice Video Problem 4-1 Part 3: Cost volume profit (CVP) analysis change in sales quantity, sales price, variable expenses LO2,3
Sweet Eats is currently selling 20,000 treats per year. A contribution margin income statement for the first year of operations is provided below. Compute net income assuming the selling price increases by 5%, variable expenses decrease by 0.45 cents per unit, and the number of units sold increases by 12%.
Review Questions
Review questions reinforce the chapter content.
Homework Questions
Homework questions can be used for additional practice or can be assigned in an academic setting. Full feedback is not available online. Homework questions can be assigned, with auto-grading and export, to specific learning management platforms, e.g., Canvas, Blackboard, etc. Contact the author for details.
Cost volume profit (CVP) analysis is a tool used to estimate how profits are affected by the following five factors: 1.) selling prices, 2.) sales volume, 3.) unit variable costs, 4) total fixed costs, or 5.) mix of products sold.
Variable costs are the same cost per unit but the total cost depends on the quantity produced, used, or sold.
Fixed cost is the same cost in total regardless of the quantity produced, used, or sold but the per-unit cost changes depending on the quantity produced, used, or sold.
Mixed cost is a cost that has both a variable and a fixed component.
An income statement reports an organization’s sales revenue less its expenses (costs) for specified period of time. On a contribution margin income statement, costs are classified as variable or fixed.
Contribution margin is calculated as Sales less Variable Expenses. It represents the margin an organization can make or lose as the number of units sold increases or decreases.
The formula to compute net operating income, sometimes referred to as net income or net profit, is the organization's revenues less its expenses.
The contribution margin ratio is calculated as Contribution Margin divided by Sales. It represents the percentage of margin you can make or lose as the number of units sold increases or decreases.
The relevant range of production is the range between a minimum and a maximum production activity where certain revenue and expense levels can be expected to occur.
Cost structure is the type and proportion of fixed and variable costs in relation to the organization's total costs.
Break even is the point at which net operating income equals zero. An organization breaks even when its sales revenue covers total costs--both variable and fixed.
Target profit is the point at which net operating income equals a specified amount. Target profit is calculated when an organization needs to know the quantity of sales required to cover total costs and earn a certain net profit.
