
1 Managerial Accounting and Cost Concepts

Learning Objectives LO
LO1 Distinguish the different purposes of financial accounting and managerial accounting
LO2 Distinguish between product and period costs and classify product costs as direct material, direct labor, or manufacturing overhead
LO3 Distinguish between fixed, mixed, and variable costs, and relate them to cost drivers
LO4 Define the relevant range of production
LO5 Use the high-low method to predict future costs
LO6 Contrast the contribution margin income statement and the traditional income statement
LO7 Construct a traditional income statement
LO8 Construct a contribution margin income statement and calculate the contribution margin amount and ratio
Managerial accounting versus financial accounting LO1
In general, financial accounting is concerned with classifying, recording, and reporting financial transactions in a formal accounting system. Financial accounting is relatively uniform and prescribed by various regulatory bodies, such as the Securities and Exchange Commission, the Financial Accounting Standards Board, and the Public Company Accounting Oversight Board. Accountants, higher management, creditors, investors, and other external users are the primary users of financial accounting reports.
Managerial accounting is concerned with classifying, analyzing, and reporting data for internal decision making. Managerial accounting tools are used by management to plan, control, and evaluate business operations and to make internal business decisions. Managerial accounting tools and reports are not prescribed by a regulatory body. Instead, they are customized to meet the specific needs of the organization’s internal users. Managers and internal decision makers are the primary users of managerial accounting reports and tools.
Cost classification: Product or period LO2
Cost classification is the process of separating costs into different categories. The costs incurred by an organization can be classified in many different ways. An important cost classification in accounting is distinguishing product costs from period costs. In financial accounting, product costs are treated differently than period costs. As a general rule, product costs are capitalized as a part of the inventory asset account; whereas, period costs are expensed as incurred.
Product costs are all costs associated with purchasing or producing inventory for resale.
Period costs are all other costs not associated with purchasing or producing inventory for resale but are necessary for sustaining the organization, selling the inventory, and servicing customers.
Merchandising business: Product and period cost classifications
A merchandising business is a business entity that purchases finished inventory products from the business that manufactures the inventory with the intent to resale it and make a profit. A merchandiser makes a profit by marking up the inventory and selling it at a higher price to its customers. Retail stores such as Walmart and Target are examples of merchandising operations.
For a merchandiser, the costs of purchasing and holding the inventory are product costs. All other costs associated with sustaining the organization and selling the product are classified as period costs. Period costs include all non-inventory costs such as rent, utilities, wages, customer service, and advertising. While period costs are important to sustaining the organization, selling the inventory, and servicing customers, they are not included in the cost of the inventory.
To illustrate, assume that Kelly owns a small business selling seat cushions at sporting events. She buys the cushions from a wholesale company for $1 each and resales them to customers at the stadium for $5 each. Last year, she sold 10,500 seat cushions. She also paid $15,000 for rent on her booth and $9,600 for miscellaneous expenses. In this example, product costs are the cost of purchasing the inventory for resell. Product costs are calculated as $1 per cushion times 10,500 sold equals $10,500. Period costs are $15,000 rent plus $9,600 miscellaneous expenses for a total of $24,600. Period costs are the other non-inventory costs Kelly incurred to run her business.
Manufacturing business: Product and period cost classifications
A manufacturing business is a business entity that uses raw materials, parts, or other components to make a finished good. The finished goods are considered inventory in a manufacturing organization. A manufacturer makes a profit by selling the inventory for more than it costs them to produce the inventory for resell.
For a manufacturer, the costs associated with making the inventory are product costs. In manufacturing, the three categories of costs included in product costs are:
Direct materials—raw materials costs that can be easily and economically traced to the production of the product.
Direct labor—manufacturing labor costs that can be easily and economically traced to the production of the product.
Manufacturing overhead—all other indirect costs associated with manufacturing the product that are not direct material or direct labor. All indirect—not direct material or direct labor—costs incurred in the manufacturing process are included in manufacturing overhead. Examples of manufacturing overhead costs include indirect materials, e.g. glue, nails, sandpaper; indirect labor, e.g. the production supervisor’s salary or quality control; and all other production costs incurred to run the production facility, e.g. rent, utilities, and taxes on the production facility.
All other costs associated with sustaining the organization and selling the product are classified as period costs. Period costs include all non-inventory costs such as the costs to provide administrative and selling services including rent, utilities, wages, customer service, and advertising. While period costs are important to sustaining the organization, selling the inventory, and servicing customers, they are not included in the cost of producing inventory.
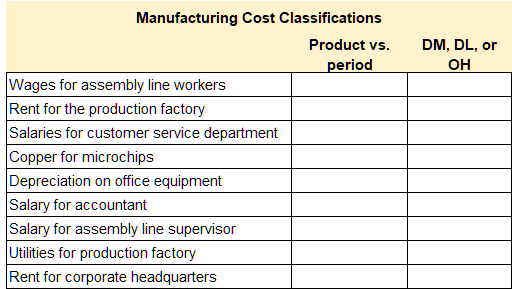
Video Illustration 1-1: Identifying product and period cost classifications for a manufacturer LO2
Cincy Chips manufactures microchips for small electronic devices. Classify the costs in Exhibit 1-1 as product costs or period costs. If the cost is a product cost, classify the cost as direct material (DM), direct labor (DL), or manufacturing overhead (OH).
The processes to solve the following scenario are demonstrated in Video Illustration 1-1 below.
Exhibit 1-1 Cost classification chart and video explanation
Check your understanding LO2
Cost behavior: Variable, fixed, and mixed LO3
Another important classification in managerial accounting is cost behavior. Cost behavior is how a cost reacts to changes in production, usage, or sales quantity. Cost behavior is classified as variable, fixed, or mixed.
Variable cost—the same cost per unit but the total cost depends on the quantity produced, used, or sold. Variable costs are variable in relation to some kind of activity driver. An activity driver is an activity that causes the incurrence of the variable cost. Common activity drivers are units of sales, units of production, direct labor hours worked, or machine hours used.
Fixed cost—the same cost in total regardless of the quantity produced, used, or sold but the per-unit cost changes depending on the quantity produced, used, or sold.
Mixed cost—a cost that has both a variable and a fixed component. The variable component of a mixed cost must be variable in relationship to an activity driver.
An effective manager must consider cost behavior in order to predict future costs.
To illustrate cost behavior assume that Big Drink Company sells drinks in souvenir cups at an entertainment venue. Big Drink purchases the souvenir cups from a manufacturer for $1 each. Then they sell the cups for $10 filled with the customer’s choice of beverage.
The cost of the souvenir cups is a variable cost. The activity driver is the number of units sold. One units sold requires one cup. The cost per cup is always $1 per unit but the total cost incurred depends on how many drinks are sold. For example, if they sell 100 drinks, the total costs are $1 times 100 equals $100. If they sell 500 drinks, the total costs are $1 times 500 equals $500. Per unit cost is always $1 but total cost changes depending on activity.
The cost of renting the booth at the entertainment venue is a fixed cost. Assume Big Drink pays $3,500 per month to rent a booth at the entertainment venue. The total cost for rent is always the same regardless of how many drinks they sell. However, the per-unit cost allocated to drinks sold changes depending on the quantity sold. For example, if Big Drink sells 100 drinks the rent amount allocated per-unit is $3,500 divided by 100 equals $35 per drink. If they sell 500 drinks, the rent amount allocated per-unit is $3,500 divided by 500 equals $7 per drink. The total cost is always $3,500 but the per unit cost changes depending on activity.
The cost charged for utilities is usually a mixed cost. For example, Big Drink pays a minimum charge regardless of how much electricity is used. The minimum charge is fixed because it does not change depending on actual usage. Then they pay a charge per kilowatt-hour used. Kilowatt-hours used is the activity driver. The charge based on kilowatt-hour is variable since it depends on usage. The total electric bill has both a fixed and variable component so it is considered a mixed cost.
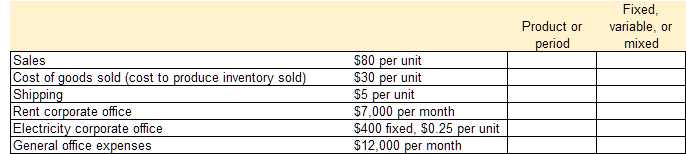
Video Illustration 1-2: Cost classification and cost behavior LOs 2,3
Cincy Chips produces microchips for small electronic devices. They produced and sold 600 microchips in the current month. Select financial data for Cincy Chips is provided in Exhibit 1-2. Determine the cost classifications and cost behavior for the below costs.
The processes to solve the following scenario are demonstrated in Video Illustration 1-2 below.
Exhibit 1-2 Cost classification/behavior chart and video explanation
Check your understanding LO3
Relevant range of production LO4
The relevant range of production is the range between a minimum and a maximum production activity where certain revenue and expense levels can be expected to occur. Revenue and expense amounts will likely increase or decrease when production activity falls outside of the relevant range. In a manufacturing environment, product and period costs can be estimated with a reasonable degree of accuracy within this relevant range of production. Cost estimates are less likely to be accurate when production falls outside of the relevant range.
For example, at Cincy Chips the manufacturing line can produce up to 1,000 units per day. Production in excess of 1,000 units per day would require the company to purchase a new manufacturing line which would significantly change the current cost estimates. Therefore, maximum production in the relevant range is set at 1,000 units.
Predicting mixed costs LO5
As mentioned in the preceding section, a mixed cost has both a variable and a fixed component. The variable component of a mixed cost must change in relation to an activity driver for the cost to be considered mixed. Accordingly, the first step to identify a mixed cost is to verify that the cost has a linear relationship to an activity driver. A linear relationship means that the cost increases or decreases as the activity driver increases or decreases.
A scatter plot chart is used to determine if a cost has a linear relationship to an activity driver. A scatter plot shows if a linear relationship exists between two sets of data – cost and activity driver in this case. If a linear relationship is shown on the scatter plot, then the cost is related to the activity driver. If a linear relationship is not shown on the scatter plot, then the cost is unrelated to the activity driver. A new scatter plot may be prepared to determine if the cost is related to a different activity driver. Alternatively, the cost may increase and decrease randomly, meaning it is not fixed, variable, or mixed. This is uncommon. Most recurring costs can be classified as fixed, variable, or mixed.
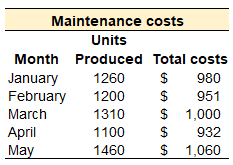
Before a scatter plot can be prepared, historical cost data must be collected. To illustrate, assume that maintenance costs are not fixed or variable. The manager believes the number of units produced is the activity driver for maintenance costs. Historical data for five months and the corresponding scatter plot is provided in Exhibit 1-3. Since the scatter plot clearly shows a linear relationship, maintenance cost is considered a mixed cost. The activity driver is the number of units produced.
Exhibit 1-3 Data for maintenance costs and corresponding scatter plot
When a linear relationship exists, the formula for a linear regression line can be used to predict mixed costs. The linear regression line formula is given in Exhibit 1-4. This is also the cost formula used to calculate mixed costs.
Exhibit 1-4 Cost formula to calculate mixed costs
Y = a + bx
High-low method for creating mixed cost formulas
The high-low method is a simple and widely used method to estimate a mixed cost's variable and fixed components. The high-low method assumes that the difference in cost between the highest use observation and the lowest use observation is the variable portion of the cost. This method isolates the variable costs attributed to the difference in the activity driver.
Continuing the example from the preceding section, the high-low method can be used to estimate the fixed and variable components of maintenance cost since the cost was identified as mixed. It is important to note that when the relationship between the cost and the activity driver is not perfectly linear, the resulting cost formula is approximate.
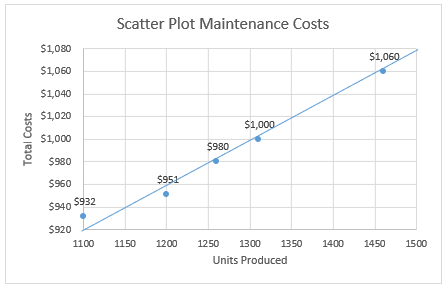
The high-low method has four steps. These steps are outlined below and illustrated using the data in Exhibit 1-3.
Step 1. Find the difference between the highest use observation and lowest use observation.
| Units Produced |
Total costs | |
| Highest (May) | 1,460 | $ 1,060 |
| Lowest (April) | 1,100 | $ 932 |
| Difference | 360 | $ 128 |
Step 2. Calculate the variable cost per unit by dividing the difference in cost by the difference in activity. The difference between the highest use and lowest use is assumed to be the variable portion incurred by the difference in activity.
$128 different in cost / 360 difference in units = $0.356 (rounded) variable cost per unit.
Step 3. For the highest or lowest observation (both will result in the same number), use the variable cost from step 2 to calculate the fixed component.
Lowest observation (May). In May, they produced 1,460 units and $0.356 per unit is variable. Total variable costs are 1,460 x 0.356 = $520 (rounded). Subtract total variable costs from the total costs in May to get total fixed costs, $1,060 – $520 variable = $540 fixed.
Highest observation (April). In April, they produced 1,100 units and $0.356 per unit is variable. Total variable costs are 1,100 x 0.356 = $392 (rounded). Subtract total variable costs from the total costs in April to get total fixed costs, $932 – $392 variable = $540 fixed.
Step 4: Create the cost formula using the data from steps 2 and 3.
The cost formula to estimate maintenance costs is $540 fixed plus $0.356 variable costs per unit of production. Using the Y = a + bx cost formula introduced above, the cost formula for maintenance costs would be stated as $540 + $0.356x, whereas x is the activity driver for the cost.
When the data is not perfectly linear, it is important to note that the cost formula produced by the high-low method only works on the highest and lowest observations since these are the data points used in the calculation. To illustrate, refer to the historical data for maintenance costs given in Exhibit 1-3. In January, 1,260 units were produced, and actual maintenance costs were $980. The high-low method cost formula would predict or estimate the cost for January as $540 fixed + ($0.356 x 1,260) = $989 (rounded). Although the cost formula produces a number that is slightly higher than the actual cost of $980, the estimate is close enough to predict costs for internal managerial accounting purposes.
Video Illustration 1-3: Using cost behavior to predict future costs LO5
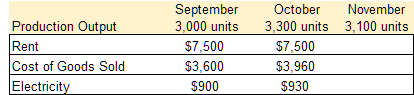
Stephanie, the production manager, is collecting data for the November budget. Cost data are generated by the manager for each department. The production manager is responsible for estimating the costs for rent expense, cost of goods sold, and electricity. Data for September and October are provided in Exhibit 1-5. Complete the budget data for November.
The processes to solve the following scenario are demonstrated in Video Illustration 1-3 below.
Exhibit 1-5 Budgeting chart and video explanation
High-low method
Step 1 – Difference Step 2 – Variable cost Step 3 – Fixed cost
Check your understanding LO5
Traditional versus contribution margin income statement LO6
An income statement also referred to as a profit and loss statement, reports an organization’s sales revenue and expenses for a specified period of time. Sales revenue is the income received by a company from its sales of goods or the provision of services. Expenses are the cost of operations that a company incurs to generate revenue. Generally, the benefit of the cost is used in the same period in which the corresponding revenue is reported. The formula to compute net operating income, sometimes referred to as net income or net profit, is the organization’s revenues less its expenses. If an organization has more revenue, the resulting number is positive and represents net income or profit. If an organization has more expenses, the resulting number is negative and represents a net loss.
On a traditional income statement, costs or expenses are classified as product or period. On a contribution margin income statement, costs or expenses are classified as variable or fixed. Regardless of how the costs are classified, reported net operating income or loss is always the same on both income statement formats.
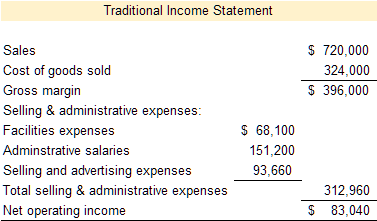
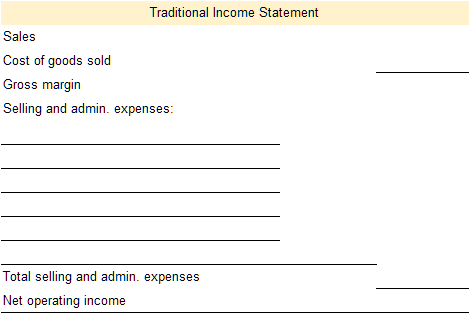
Traditional income statement LO7
A traditional income statement is primarily used for financial reporting purposes. A traditional income statement, reports an organization’s revenue and expenses for a specified period of time. On a traditional income statement, the organization’s expenses are presented based on product cost and period cost classifications.
Video Illustration 1-4: Traditional income statement explained
An example of a traditional income statement is presented in Exhibit 1-6 and discussed in Video Illustration 1-4.
Exhibit 1-6 Traditional income statement and video explanation
Check your understanding LO6, LO7
Video Illustration 1-5: Preparing a traditional income statement LO7
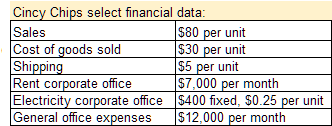
Cincy Chips manufactures microchips for small electronic devices. They produced and sold 600 microchips in the current month. Select financial data for Cincy Chips is provided in Exhibit 1-7. Prepare a traditional income statement.
The processes to solve the following scenario are demonstrated in Video Illustration 1-5 below.
Exhibit 1-7 Financial data, traditional income statement format, and video explanation
Check your understanding LOs 6,7
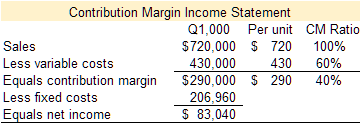
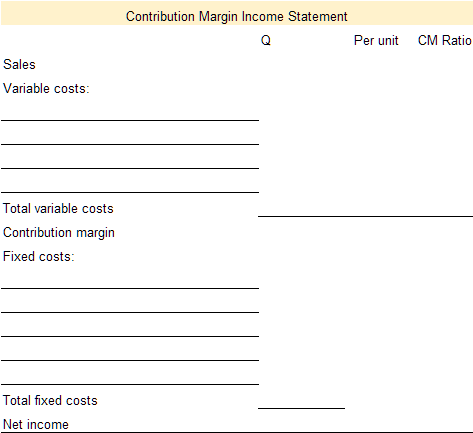
Contribution margin income statement LO8
A contribution margin income statement is primarily used by internal users, usually management, for planning operations, controlling operations, and making decisions. Like a traditional income statement, the contribution margin income statement reports an organization’s revenue and expenses for a specified period of time. The contribution margin income statement classifies expenses on the basis of cost behavior—variable versus fixed.
Video Illustration 1-6: Contribution margin income statement explained LO8
An example of a contribution margin income statement is presented in Exhibit 1-8 and discussed in Video Illustration 1-6.
Exhibit 1-8 Contribution margin income statement and video explanation
Check your understanding LO8
Video Illustration 1-7: Preparing a contribution margin income statement LO8
Cincy Chips produces microchips for small electronic devices. They produced and sold 600 microchips in the current month. Select financial data for Cincy Chips is provided in Exhibit 1-9. Prepare a contribution margin income statement.
The processes to solve the following scenario are demonstrated in Video Illustration 1-7 below.
Exhibit 1-9 Financial data, contribution margin income statement format, and video explanation
Check your understanding LO8
Practice Video Problems
The chapter concepts are applied to comprehensive business scenarios in the below Practice Video Problems.
Practice Video Problem 1-1: Product, period, fixed, and variable costs LOs 2, 3, 4
Crazy Candy’s Carpets makes whimsical and eccentric rugs. The relevant range of production is 10,000 to 14,000 units per month. When she produces and sells 12,000 units the average costs per unit are as follows:
Required 1: What is the total amount of product costs incurred to make 14,000 units?
Required 2: What is the total amount of period costs incurred to sell 14,000 units?
Required 3: What is the total amount of costs incurred to make and sell 11,000 units?
Practice Video Problem 1-2: Traditional income statement LO6
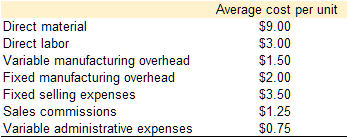
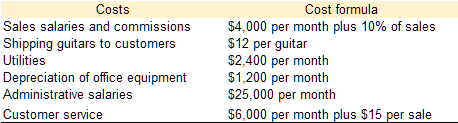
Magick Musicals sells custom guitars that they purchase from a local artist. Magick purchases the guitars from the artist for $960 each, marks them up, and resells them for $2,200 each. Magick’s general and administrative costs are presented below.
In May, Magick purchased and sold 150 guitars.
Required: Prepare a traditional format income statement for May
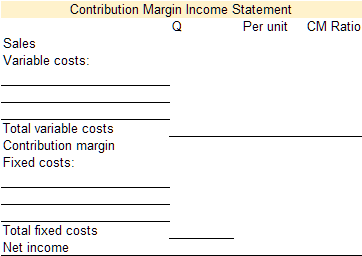
Practice Video Problem 1-3: Contribution margin income statement LO7
Magick Musicals sells custom guitars that they purchase from a local artist. Magick purchases the guitars from the artist for $960 each, marks them up, and resells them for $2,200 each. Magick’s general and administrative costs are presented below.
In May, Magick purchased and sold 150 guitars.
Required: Prepare a contribution margin income statement for May. Show revenue and variable costs on both a total and a per-unit basis.
Review Questions
Review questions reinforce the chapter content.
Review 1-1
Review 1-2
Review 1-3
Review 1-4
Review 1-5
Review 1-6
Review 1-7
Homework Questions
Homework questions can be used for additional practice or can be assigned in an academic setting. Full feedback is not available online. Homework questions can be assigned, with auto-grading and export, to specific learning management platforms, e.g., Canvas, Blackboard, etc. Contact the author for details.
Homework 1-1
Homework 1-2
Homework 1-3
Homework 1-4
Homework 1-5
Homework 1-6
Homework 1-7
Homework 1-8
Homework 1-9
Homework 1-10
Financial accounting is concerned with classifying, recording, and reporting financial transactions in a formal accounting system
Managerial accounting is concerned with classifying, analyzing, and reporting data for internal decision making.
Cost classification is the process of separating costs into different categories.
Product costs are all costs associated with purchasing or producing inventory for resale.
Period costs are all other costs not associated with purchasing or producing inventory for resale but are necessary for sustaining the organization, selling the inventory, and servicing customers.
A merchandising business is a business entity that purchases finished inventory products from the business that manufactures the inventory with the intent to resale it and make a profit. A merchandiser makes a profit by marking up the inventory and selling it at a higher price to its customers
A manufacturing business is a business entity that uses raw materials, parts, or other components to make a finished good.
Direct materials are raw materials costs that can be easily and economically traced to the production of the product.
Direct labor is manufacturing labor costs that can be easily and economically traced to the production of the product.
Manufacturing overhead are all other indirect costs associated with manufacturing the product that are not direct material or direct labor.
Cost behavior is how a cost reacts to changes in production, usage, or sales quantity. Cost behavior is classified as variable, fixed, or mixed.
Variable costs are the same cost per unit but the total cost depends on the quantity produced, used, or sold.
An activity driver is an activity that causes the incurrence of the variable cost. Common activity drivers are units of sales, units of production, direct labor hours worked, or machine hours used.
Fixed cost is the same cost in total regardless of the quantity produced, used, or sold but the per-unit cost changes depending on the quantity produced, used, or sold.
Mixed cost is a cost that has both a variable and a fixed component.
The relevant range of production is the range between a minimum and a maximum production activity where certain revenue and expense levels can be expected to occur.
A scatter plot shows if a linear relationship exists between two sets of data.
The high-low method is used to estimate the variable and fixed components of a mixed cost. The difference between the highest use observation and the lowest use observation is considered the variable portion of the cost.
An income statement also referred to as a profit and loss statement, reports an organization’s revenue and expenses for a specified period of time.
Sales revenue is the income received by a company from its sales of goods or the provision of services.
An expense is a cost of operations that a company incurs to generate revenue. Generally, the benefit of the cost is used in the same period in which the corresponding revenue is reported.
The formula to compute net operating income, sometimes referred to as net income or net profit, is the organization's revenues less its expenses.
An income statement reports an organization’s sales revenue less its expenses (costs) for specified period of time. On a traditional income statement, costs are classified as product or period.
An income statement reports an organization’s sales revenue less its expenses (costs) for specified period of time. On a contribution margin income statement, costs are classified as variable or fixed.
