5 Segmented Income Reporting
Learning Objectives LO
LO1 Explain the purposes and advantages of segmented income reporting
LO2 Prepare a segmented income statement
LO3 Compute contribution margin and segment margin
LO4 Identify and account for segment traceable fixed costs and common fixed costs
LO5 Segments within segments
LO6 Segment cost volume profit analysis
LO7 Compute breakeven for the whole organization as well as individual segments within the organization
Purposes of segmented income reporting LO1
In addition to companywide income reporting, managers or owners also need to measure the profitability of individual segments within their organizations. Anorganizational segment is a part or activity within an organization about which managers would like cost, revenue, or profit data. Organizational segments can include divisions, individual stores, geographic regions, customers, or product lines. For example, Graeters Ice Cream will look at the profitability of the company as a whole as well as the profitability of each individual retail location. The individual stores are considered segments within the organization. Graeters might also look at the profitability of product lines across all locations. In this case, the data would be segmented by product lines, such as ice cream and bakery items. A large or complex organization may segment the overall financial data in multiple ways in order to analyze the various parts.
The contribution margin format is used to prepare segmented income statements. The contribution margin income statement classifies costs on the basis of cost behavior. Cost behavior is how a cost reacts to changes in production or sales quantity. Cost behavior is classified as variable, fixed or mixed.
The company Media Masters is used in the following sections to demonstrate the process of preparing segmented income statements. Media Masters is a rapidly growing social media game development company. The company’s programmers develop online games for social media applications and cell phones.
Video Illustration 5-1: Overview of organizational segments LO1
Media Masters recently launched a series of successful social media games causing a spike in customer subscriptions and sales revenue. To manage growth and make informed decisions, the company’s Chief Operating Officer requested the company’s contribution margin income statement as well as segmented income statements.
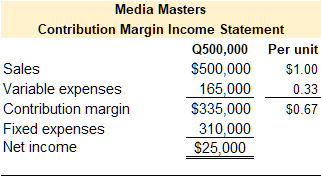
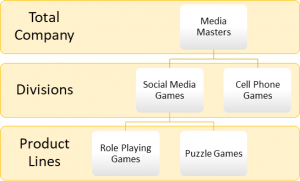
A contribution margin income statement for the total company and an example of the company’s segments are presented in Exhibit 5-1. Media Masters is currently reporting total net operating income of $25,000. The company has two major divisions–social media games and cell phone games. Each division can be further segmented into product lines. For example, the social media games division consists of two major project lines–role playing games and puzzle games.
Exhibit 5-1 Media Masters contribution margin income statement, organizational segments, and video explanation

Check your understanding LO1
Prepare a segmented income statement LO2
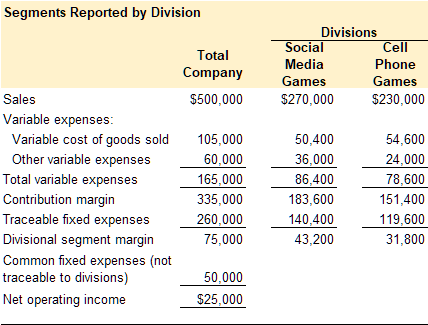
A segmented income statement is based on the contribution margin income statement format. The contribution margin income statement and segmented income statement by division for Media Masters is presented in Exhibit 5-2. Notice that net operating income $25,000 is the same on both statements. Although variable and fixed costs are allocated differently on the segmented income statement, net operating income will always be the same.
Exhibit 5-2 Media Masters Contribution margin income statement and Segmented income statement by division

There are two major differences between a segmented income statement and a contribution margin income statement. First, contribution margin income statement reports one contribution margin whereas the segmented income statement reports the contribution margin as well as the segment margin. Second, the contribution margin income statement reports fixed expenses in total whereas the segmented income statement divides fixed expenses between traceable fixed expenses or costs and common fixed expenses or costs. Both of these differences are discussed in detail in the below sections.
Contribution margin and segment margin LO3
Contribution margin
Segmented income reporting traces sales revenue, variable costs, and fixed costs to the organizational segments responsible for generating the sales revenue or costs. Since sales revenue and variable costs are typically driven by units sold these items can be easily traced to a particular segment. For example, it is easy to determine if a sale was a social media game or a cell phone game.
As illustrated in Exhibit 5-2, both the contribution margin income statement and the segmented income statement report contribution margin. Contribution margin is computed the same way on both statements. Contribution margin is calculated as sales revenue less variable expenses. Sales revenue is considered a variable revenue. Both sales revenue and variable expenses are typically driven by units of sales or units of production. Since unit sales and units of production are easily traceable to a division, sales revenue and variable expenses are generally easy to allocate to a specific segment.
Segment margin
Refer to Exhibit 5-2. The contribution margin is $335,000 for both the contribution margin income statement and the segmented income statement. Contribution margin is the sales revenue less variable expenses on both statements. On the segmented income statement, traceable fixed costs are subtracted from the contribution margin to calculate the segment margin. Segment margin represents the sales revenue of a particular segment less variable expenses and fixed expenses that are traceable to the segment. Or, segment margin can be interpreted as the profitability of a particular segment before common fixed costs are incurred.
Common fixed costs are not allocated to a particular segment since they are common costs. Instead, common fixed costs are subtracted from the total company segment margin to arrive at net operating income. For Media Masters in Exhibit 5-2, the total divisional segment margin is $75,000. Common fixed costs are subtracted from the total divisional segment margin to arrive at net operating income of $25,000.
Check your understanding LO3
Fixed costs and the segmented income statement LO4
Unlike variable revenue and variable costs, fixed costs are more difficult to allocate to segments since some fixed costs are generated by a particular segment and some fixed costs are common to all the segments.
Traceable fixed costs
Traceable fixed costs are costs that can be traced directly to an organizational segment. For example, assume that the social media games segment employs a product developer that works solely on social media games. Her salary is a fixed cost that is traceable to that division. Another way to look at traceable fixed costs is that they are costs that would be eliminated if the segment were eliminated.
Refer to the contribution margin income statement in Exhibit 5-2. Total fixed costs for Media Masters is $310,000. Now refer to the segmented income statement in Exhibit 5-2. Of the $310,000 in total fixed costs, management determined that $260,000 were traceable to the two divisions, with $140,400 traceable to the social media games division and $119,600 traceable to the cell phone games divisions.
Common fixed costs
Common fixed costs are costs that are common to, or shared by, all organizational segments. For example, the President of Media Masters manages both divisions. Her salary would be considered a common fixed cost since it is not traceable to a particular segment. For the purposes of segment income reporting, common fixed costs are not used to calculate the segment margin since these costs are not traceable to the segment and would not be eliminated if the segment were eliminated. Instead, common fixed costs are deducted from the segment margin to arrive at net operating income.
Refer to the segmented income statement in Exhibit 5-2. Total fixed costs less traceable fixed costs leaves common fixed costs, $310,000 – 260,000 = $50,000 common fixed costs. Since these costs are shared by the segments, they are not used to calculate the segment margin.
Check your understanding LO4
Organizational segments within segments LO5
An organization can have many layers of segments. Larger organizational segments can be further divided into segments within that segment. Refer to Exhibit 5-3 below. Media Masters has two large divisions–social media games and cell phone games. The social media games division can be further divided into product lines–role playing games and puzzle games.
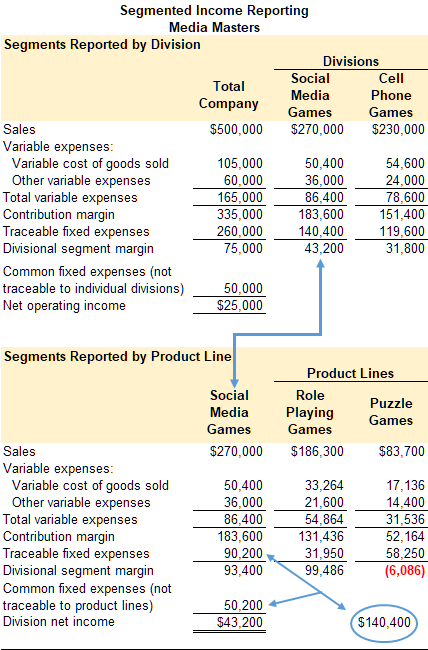
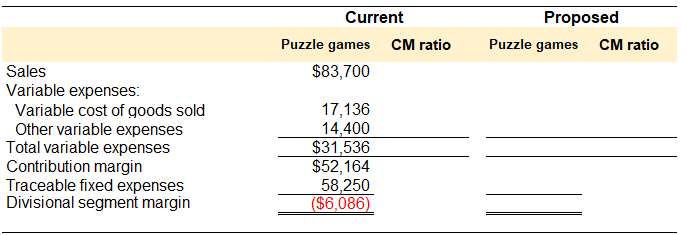
It is important to note, that common fixed costs are not considered when a larger segment is divided into smaller segments. The segment margin for the larger segment is the total amount allocated to the smaller segments. Refer to Exhibit 5-3 below, the segment margin for social media games is $43,200. When further segmented by product lines within the social media games segment, this amount becomes the total amount for the social media games segment. Variable revenue and variable expenses are then allocated between the product lines. Total segment fixed costs are divided into fixed costs traceable to the project lines and common fixed costs. To illustrate, of the $140,400 of total fixed costs allocated to the social media games segment, $31,950 and $58,250 are traceable to role playing games and puzzle games respectively. The remaining $140, 400 – 31,950 – 58,250 = $50,200 becomes common fixed costs allocated to the social media games segment.
Exhibit 5-3 illustrates the functionality of segmented income statement reporting. Media Masters is reporting net operating income of $25,000. While total company net operating income is valuable information, it does not show which segments within the organization are performing well and which are not. As shown in Exhibit 5-3, the social media games division is profitable overall however only one of the product lines within that division is profitable. Segmented income statements provide detailed information for management to make informed decisions about particular segments within an organization.
Exhibit 5-3 Media Masters segmented income statement by division and product line
Segment cost volume profit (CVP) analysis LO6
Cost volume profit (CVP) analysis can be applied to the whole organization and to particular segments within the organization. Cost volume profit analysis is covered in detail in chapter 4. Cost volume profit analysis requires a contribution margin format income statement. Segmented income statements for segments within an organization or subsegments within a larger segment are prepared using the contribution margin format, so it is possible to use cost volume profit analysis on individual segments. Cost volume profit analysis is used to make important decisions about selling prices, sales volume, unit variable costs, total fixed costs, and the mix of products sold.
Video Illustration 5-2: Segment cost volume profit analysis LO6
Media Masters’ segmented income statement for the social media product lines is shown in Exhibit 5-3. Currently, the puzzle games product line is showing a net operating loss of $(6,086). Management is considering additional social media advertising to promote the puzzle games product line. The accountant estimated that spending an additional $10,000 on advertising would result in $24,000 in additional sales revenue for the puzzle games product line. Should management invest in the social media advertising campaign?
The processes to solve this scenario are demonstrated in Video Illustration 5-2.
Exhibit 5-4 Media Masters contribution margin statement template and video explanation

Breakeven calculations for segmented income reporting LO7
Breakeven is the point at which net operating income equals zero. Breakeven can be computed for the whole organization or for individual segments within the organization. Or, an organization or segment breaks even when its sales revenue covers its total costs–both variable and fixed. The formulas to compute breakeven in sales dollars for the whole organization as well as breakeven in sales dollars for segments within the organization are provided below.
Exhibit 5-5 Breakeven formulas

*Contribution margin ratio or CM ratio (contribution margin in dollars/sales revenue in dollars)
Video Illustration 5-3: Computing breakeven LO7
Media Masters’ segmented income statement for the total company and its two divisions is presented in Exhibit 5-6. Compute breakeven for the whole organization and breakeven for the social media games division.
Exhibit 5-6 Media Masters data and video explanation for computing breakeven

Breakeven in sales dollars for the whole organization
Breakeven in sales dollars for social media games segment

Check your understanding LO7
Practice Video Problems
The chapter concepts are applied to comprehensive business scenarios in the below Practice Video Problems.
Practice Video Problem 5-1 Part 1: Segmented income statements LOs2,3,4
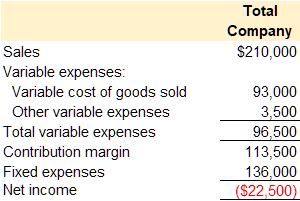
Whole Universe, a wholesale distributor of electronic products, has been experiencing losses for the last two fiscal quarters. The most recent quarterly contribution margin income statement is presented below.
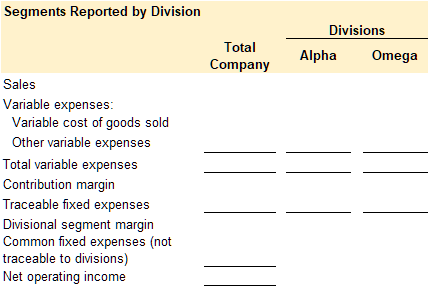
In an effort to isolate the problem, the CFO asked for segmented income reporting by division. The company has two divisions, Alpha and Omega. Additional divisional data is provided below.

Required 1: Prepare a contribution format income statement segmented by divisions.

Practice Video Problem 5-1 Part 2: Segment cost volume profit analysis LO6
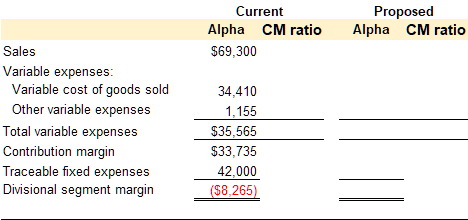
Required 2: As a result of a marketing study, the CFO believes that sales in the Alpha division could be increased to $97,000 if monthly advertising traceable to the Alpha division were increased by $6,000. Would you recommend the proposed increase to advertising? Show computations to support your answer.

Practice Video Problem 5-2: Companywide and segment breakeven LO7
Ba Boutique sells high-end, custom-made clothes. The company has two branch locations in Ohio, one in Cincinnati and one in Loveland. Ba Boutique’s segmented income statement for the total company and branch locations is provided below.
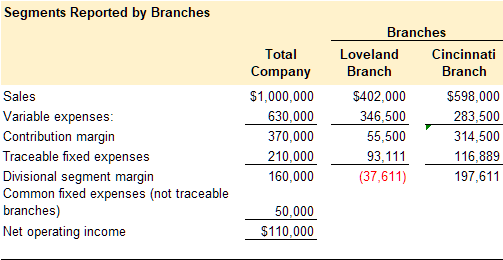
Required 1: Compute breakeven in sales dollars for the whole organization.
Required 2: Compute breakeven in sales dollars for the Loveland Branch
Required 3: Compute breakeven in sales dollars for the Cincinnati Branch

Review Questions
Review questions reinforce the chapter content.
Review 5-1
Review 5-2
Review 5-3
Review 5-4
Homework Questions
Homework questions can be used for additional practice or can be assigned in an academic setting. Full feedback is not available online. Homework questions can be assigned, with auto-grading and export, to specific learning management platforms, e.g., Canvas, Blackboard, etc. Contact the author for details.
Homework 5-1
Homework 5-2
Homework 5-3
Homework 5-4
Homework 5-5
Homework 5-7
Homework 5-8
Homework 5-6
An organizational segment is a part or activity within an organization about which managers would like cost, revenue, or profit data. Organizational segments can include divisions, individual stores, geographic regions, customers, or product lines.
Segmented income statements allocate revenue and cost to the identified segments within an organization and report the profitability of each segment.
An income statement reports an organization’s sales revenue less its expenses (costs) for specified period of time. On a contribution margin income statement, costs are classified as variable or fixed.
Variable costs are the same cost per unit but the total cost depends on the quantity produced, used, or sold.
Fixed cost is the same cost in total regardless of the quantity produced, used, or sold but the per-unit cost changes depending on the quantity produced, used, or sold.
Mixed cost is a cost that has both a variable and a fixed component.
The formula to compute net operating income, sometimes referred to as net income or net profit, is the organization's revenues less its expenses.
Contribution margin is calculated as Sales less Variable Expenses. It represents the margin an organization can make or lose as the number of units sold increases or decreases.
The segment margin is calculated as the sales revenue traceable to an organizational segment less the variable costs traceable to an organizational segment.
Traceable fixed costs are costs that can be traced directly to an organizational segment.
Common fixed costs are costs that are common to, or shared by, all organizational segments.
Segmented income reporting traces sales revenue, variable costs, and fixed costs to the organizational segments responsible for generating the sales revenue or costs.
Sales revenue is the income received by a company from its sales of goods or the provision of services.
Cost volume profit (CVP) analysis is a tool used to estimate how profits are affected by the following five factors: 1.) selling prices, 2.) sales volume, 3.) unit variable costs, 4) total fixed costs, or 5.) mix of products sold.
Breakeven is the point at which net operating income equals zero, when sales revenue covers total costs--both variable and fixed.


