7 Flexible Budgeting and Performance Evaluation
Learning Objectives LO
LO1 Describe planning budgets
LO2 Prepare a planning budget
LO3 Describe the limitations of planning budgets
LO4 Prepare a flexible budget
LO5 Prepare a flexible budget performance evaluation report
LO6 Calculate and analyze activity variances
LO7 Calculate and analyze revenue and spending variances
Planning budgets LO1
A planning budget is a detailed financial plan for future time periods. An organization’s collection of planning budgets is known as the master budget. The master budget and the processes used to create the planning budgets contained in the master budget are covered in detail in chapter 6. Planning budgets are prepared before the budgeted time period begins. For this reason, the amounts used to construct the planning budgets are estimates, not actual amounts. Organizations use historical data along with sales and production projections to make the estimates used in the planning budgets.
Estimated sales typically drive an organization’s revenue, expense, and profit projections. Cost formulas and revenue formulas are used to compute the individual amounts forecasted in the planning budgets. A cost formula is used to predict the expected cost for a specific expenditure. A revenue formula is used to predict expected revenue for a given level of sales activity.
The cost and revenue formulas used for budgeting are developed based on cost or revenue behavior. Costs and revenues are classified into one of three categories of cost behavior—variable, fixed, or mixed. Variable costs or revenues are the same amount per unit, but the total amount depends on quantity. Fixed costs or revenues are the same in total regardless of quantity, but the per unit amount changes depending on the quantity. And mixed costs or revenues have both a variable and a fixed component.
Variable and mixed revenue formulas and cost formulas are driven by an activity driver, such as expected sales or production. Most revenues are considered variable, so only costs are discussed in the following category descriptions.
Variable costs. The cost formula for a variable cost is the cost per unit times the activity driving the cost, usually sales or production. For example, assume that shipping costs are $4 for every unit sold. Shipping is a variable cost since it is always $4 per unit, but the total depends on how many units are sold. The cost formula for shipping would be $4 per unit sold, which is noted as $4Q, where Q equals the activity driver, quantity sold in this case.
Fixed costs. The cost formula for fixed costs is a lump sum amount. For example, assume that rent expense is $2,000 a month. The cost formula for rent would be $2,000 per month in total. However, if the cost for rent is allocated to the units produced or sold, the per unit amount for rent will change depending on the quantity sold or produced. For example, if production is 100 units, rent expense is allocated as $2,000 / 100 units = $20 per unit. However, if production is 1,000 units, rent expense is allocated as $2,000 / 1,000 units = $2 per unit. Regardless of quantity, the total is always $2,000.
Mixed costs. The cost formula for mixed costs has both a variable and a fixed component. Utilities are a good example of a mixed cost. Typically, utility companies charge a fixed monthly fee plus a charge per unit for the services used. For example, assume that electricity is $50 per month plus $0.25 per kilowatt used. The cost formula for electricity would be $50 plus $0.25 times the quantity used, which is noted as $50 + $0.25Q, where Q equals the activity driver, kilowatts in this case.
Prepare a planning budget LO2
Before a planning budget can be prepared, the revenue formulas and cost formulas necessary to complete the particular budget need to be compiled. This chapter will focus on the budgeted income statement. An income statement shows an organization’s revenues less its expenses to arrive at net operating income or net operating loss. On a traditional income statement, costs or expenses are classified as product or period.
The example of Healthy Mats is used to illustrate how a planning budget is prepared. Amara designed a PEMF therapy mat. The PEMF mat emits low-frequency waves. PEMF therapy is a nonpharmaceutical intervention for treating chronic pain, acute injuries, and overall cellular regeneration. The revenue formula and cost formulas for Healthy Mats’ budgeted income statement are given in Exhibit 7-1.
Exhibit 7-1 Healthy Mats revenue and costs formulas for the planning budget income statement
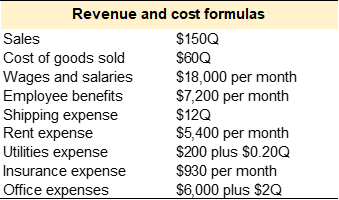
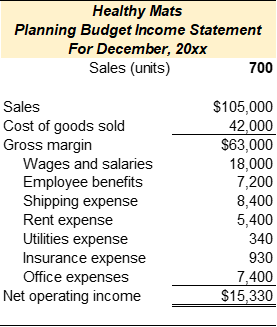
Amara uses the revenue and cost formulas given in Exhibit 7-1 to compile the planning budget income statement. Amara estimates that she will sell 700 units in December. The planning budget income statement is provided in Exhibit 7-2 below.
Variable revenue and costs. The revenue formula and cost formulas for sales ($150Q), cost of goods sold ($60Q), and shipping expense ($12Q) are variable. Total revenue or cost is calculated as the per unit amount times estimated sales quantity, 700 units in this case. Total sales revenue is 700 x $150 = $105,000, and total cost of goods sold is 700 x $60 = $42,000.
Fixed costs. Since the cost formulas for wages and salaries, employee benefits, rent expense, and insurance expense are fixed, total costs are given. Fixed costs do not change in relation to changes in sales activity.
Mixed costs. The cost formulas for utilities expense and office expenses are mixed, so they have a fixed and a variable component. The fixed component does not change in relation to sales quantity; however, the variable component does change in relation to sales quantity. The total cost for utilities expense is $200 + (700 x $0.20) = $340, and the total cost for office expenses is $6,000 + (700 x $2) = $7,400.
Exhibit 7-2 Healthy Mats planning budget income statement
Video Illustration 7-1: Preparing a planning budget income statement LO2
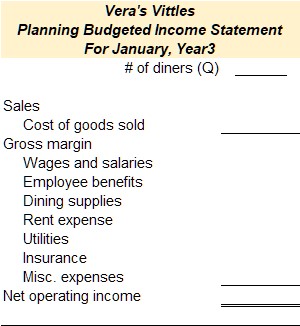
Vera, a self-trained chef, opened a new restaurant called Vera’s Vittles in a historic, inner-city neighborhood. Her menu showcases classic Southern dishes passed down from her great grandmother. Since opening approximately two years ago, the restaurant has received rave local reviews and was recently named the best Southern restaurant in the city. At the end of December, Vera wants to prepare a planning budgeted income statement for the upcoming month, January. Her revenue formula and cost formulas are given in the chart below. Vera estimates approximately 2,000 diners will eat at the restaurant in January. Prepare a planning budgeted income statement for Vera’s Vittles for the month of January.
Exhibit 7-3 Preparing a planning budget income statement video explanation


Check your understanding LO 1
Limitations of planning budgets LO3
Planning budgets are helpful in the planning and controlling phases of operations but not as useful for performance evaluation. During the planning phase, these budgets are used by management to help plan operations, including activities such as scheduling production, purchasing materials, and making capital investments. And during the controlling phase, planning budgets set forth revenue targets and spending limitations.
It is usually not appropriate to use a planning budget during the performance evaluation phase of operations. The reason is that the actual quantity sold or produced is rarely the same as the estimated quantity projected in the planning budget. Performance evaluation occurs at the end of the budget cycle and is the process of comparing the budgeted estimates to the actual results. While planning budget quantities are usually close to actual results, it is nearly impossible to predict the actual sales quantity and costs before the period begins. If the planning budget and actual results are based on different sales quantities, they cannot be directly compared.
The example of Healthy Mats is continued to illustrate the limitations of using planning budgets for performance evaluation. Assume that the company actually sold 750 units during January. At the beginning of January, Amara generated the actual income statement showing the actual revenue earned and expenses incurred. The planning budget income statement and the actual income statement are provided in Exhibit 7-4.
Exhibit 7-4 Healthy Mats planning budget income statement and actual income statement
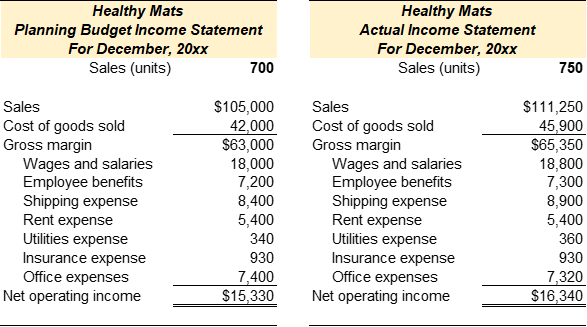
Refer to Exhibit 7-4 above. Since the actual sales quantity is higher than the planned sales quantity, it makes sense that both actual revenue and expenses are higher than the budgeted amounts. However, it is difficult to determine how much higher revenue and expenses should be in the actual income statement. Accordingly, it is difficult to determine if the revenue targets and expense limitations were achieved, not achieved, or exceeded.
Video Illustration 7-2: Incompatibility of planning budgets and actual results for performance evaluation LO3
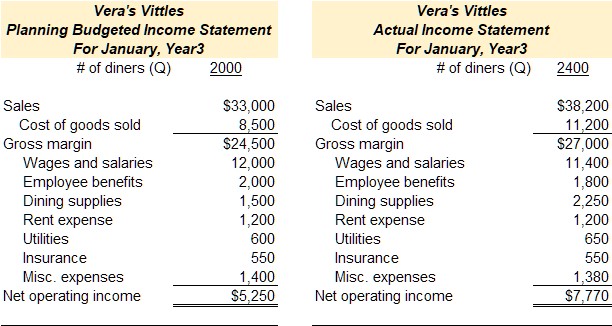
Assume that on February 1st Vera ran the below accounting report from her computerized accounting system showing the actual income statement for the month of January. The report includes the actual revenue collected from customers and the actual cash paid for expenses. During January, Vera actually served 2,400 diners. Can you evaluate Vera’s actual performance against the planning budget prepared in December?
Exhibit 7-5 Planning budgeted income statement and actual income statement video explanation

Check your understanding LO2
Prepare a flexible budget LO4
Planning budgets are prepared before the period begins and are based on the planned level of activity for the period. The actual level of activity, as well as the actual financial results, are known after the period is over. If the planned activity is different from the actual activity, the planning budget cannot be used to evaluate performance during the period. Instead, a flexible budget must be prepared for performance evaluation.
A flexible budget is the planning budget forecasted using the actual level of activity instead of the planned level of activity. The flexible budget uses the same cost formulas as the planning budget but is prepared using the actual sales quantity as the activity driver. The flexible budget adjusts revenue and expenditure targets to match the actual level of activity. Reforecasting enables the user to compare flexible budget targets to actual results and evaluate actual performance.
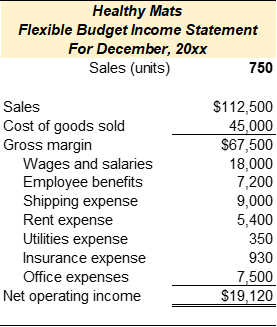
The flexible budget income statement for Healthy Mats is provided in Exhibit 7-6. The flexible budget uses actual quantity with the planning revenue and cost formulas given in Exhibit 7-1 above. The company actually sold 750 units during January.
Exhibit 7-6 Healthy Mats flexible budget income statement
Video Illustration 7-3: Preparing a flexible budget income statement LO4
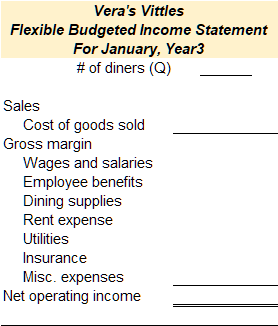
In December, Vera estimated approximately 2,000 diners would eat at the restaurant in January. She prepared a planning budget based on 2,000 diners. During January, Vera actually served 2,400 diners. Her revenue formula and cost formulas are given in the chart below. Prepare a flexible budgeted income statement.
Exhibit 7-7 Preparing a flexible budget income statement video explanation


Check your understanding LO3
Prepare a flexible budget performance evaluation report LOs 5,6,7
Flexible budget variances are used in the performance evaluation phase. A variance is any discrepancy found when two or more items are compared. Flexible budget variances are the discrepancies between the planning budget, flexible budget, and actual operating results.
There are two main types of variances evaluated when flexible budgets are analyzed—activity variances and revenue and spending variances. Variances are classified as favorable or unfavorable depending on the perceived effect of the difference on the organization. For example, a variance indicating an increase in revenue is considered favorable, whereas a variance indicating an increase in expenses is considered unfavorable.
Activity variances are the difference between the planning budget and the flexible budget. Activity variances are solely the result of changing the activity level from the planning quantity used for the planning budget to the actual quantity used for the flexible budget.
Revenue and spending variances are the difference between the flexible budget and the actual financial results. Revenue and spending variances are used to evaluate how well the organization achieved revenue, cost, and profit targets.
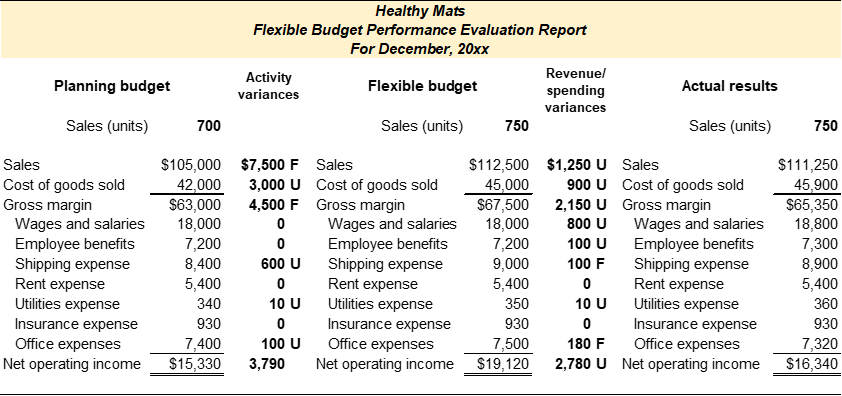
A flexible budget performance evaluation report shows the planning budget, flexible budget, actual results, activity variances, and revenue and spending variances. The flexible budget performance evaluation report for Healthy Mats is provided in Exhibit 7-8 and discussed below.
Exhibit 7-8 Healthy Mats flexible budget performance evaluation report
Analyzing activity variances LO6
As stated above, activity variances are the difference between the planning budget and the flexible budget. Activity variances are solely the result of changing the activity level from the planning quantity used for the planning budget to the actual quantity used for the flexible budget. To calculate the activity variances, subtract the planning budget amount and the flexible budget amount. All variances are shown as positive numbers even if the resulting calculation is negative. For example, the activity variance for sales is $105,000 – 112,500 = $7,500, the cost of goods sold activity variance is $42,000 – 45,000 = $3000, and so forth.
Activity variances are classified as favorable or unfavorable depending on the perceived effect of the difference on the organization. For example, Amara planned to earn $105,000 in sales revenue. However, she sold more units than planned, so her projected revenue is $7,500 higher. Since projected revenue for the actual number of units sold is more than planned revenue, the variance is favorable (F). The $4,500 increase in gross margin and the $3,790 increase in net operating income are also favorable (F). Higher gross margin and net operating income means that the organization was more profitable.
The logic for analyzing expense activity variances is the opposite. She planned to spend $42,000 on cost of goods sold. However, she sold additional units, so her projected cost of goods sold increased to $45,000. The $3,000 in increased cost of goods sold expense is unfavorable (U). The activity variances for fixed costs are zero since the same cost formulas are used for the planning and flexible budget. The activity variances for the remaining variable or mixed costs will be unfavorable if the actual quantity is higher than the planned quantity and favorable if the actual quantity is lower than the planned quantity.
Caution must be exercised when analyzing activity variances. Variable and mixed costs are assumed to increase and decrease in relation to sales quantity. For example, Healthy Mats sold 50 more units than they had planned. Each unit was shipped to the customer. Therefore, $600 in additional shipping expenses is expected. If Healthy Mats had sold 50 units less than planned, variable and mixed expenses would be lower on the flexible budget. Although lower expenses are considered favorable, selling fewer units is not favorable for the organization overall.
Analyzing revenue and spending variances LO7
Revenue and spending variances are the difference between the flexible budget and the actual financial results. The flexible budget and actual results are based on the same sales quantity, so they are comparable. Revenue and spending variances are used to evaluate how well the organization achieved revenue, cost, and profit targets. To calculate the revenue and spending variances, subtract the flexible budget amount and the actual amount. All variances are shown as positive numbers even if the resulting calculation is negative. For example, refer to Exhibit 7-9. The revenue variance for sales is $112,500 – 111,250 = $1,250, the cost of goods sold activity variance is $45,000 – 45,900 = $900, and so forth.
Revenue and spending variances are classified as favorable if the organization achieved its revenue, cost, and profit targets and unfavorable if it did not achieve these goals. In Exhibit 7-9, the flexible budget projected sales revenue of $112,500, but the actual revenue was $1,250 less. This decrease in revenue is unfavorable. The organization missed its revenue target. Amara would use this information to investigate the cause of the revenue variance and make corrections as required. She may find that she offered coupon codes in December to boost sales and did not account for this when she prepared the revenue cost formulas for the budget. Alternatively, she may find that the customer service representative offered discounts due to shipping delays. In this case, Amara would need to investigate the delays and take corrective action if possible.
The logic used to analyze spending variances is the opposite of the logic used for revenue variances. For example, cost of goods sold was $900 more than projected on the flexible budget. An increase in an expense is unfavorable. Amara would use this information to determine if the increased cost was due to unforeseen production issues or if the increase was permeant, such as an increase in raw materials or labor costs. Depending on the cause, she might try to resolve the production issues or increase her variable cost per unit for the cost of goods sold cost formula.
Overall, the revenue variance for net income is $2,780 unfavorable. Healthy Mats did not meet the revenue or spending targets they projected for a sales level of 750 units. As mentioned above, the cause of each revenue and spending variance should be investigated, and corrective action should be taken when possible. If it is determined that the cause of the variance is long-term or permeant, then the revenue formulas or cost formulas used for budgeting should be updated.
Video Illustration 7-4: Preparing flexible budget performance evaluation report and analyzing the variances LOs5,6,7
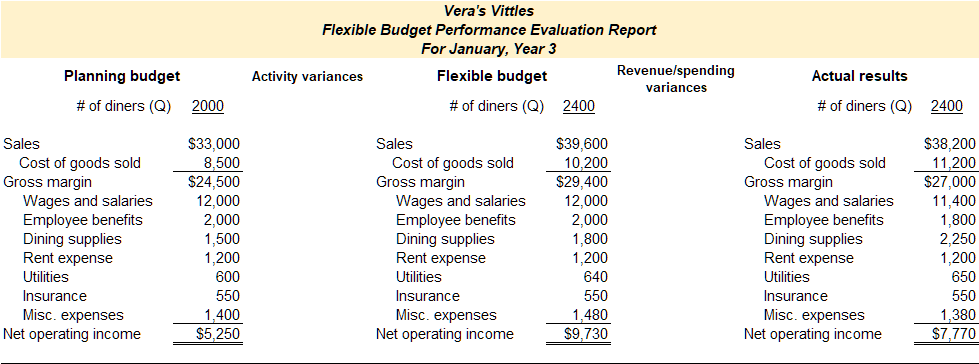
For this illustration, assume that Vera wants to analyze activity variances as well as the spending and revenue variances found when the planning budget, flexible budget, and actual results are compared. Prepare a flexible budget performance evaluation report detailing these variances.
Exhibit 7-9 Preparing flexible budget performance evaluation report and analyzing the variances video explanation

Check your understanding LO5
Practice Video Problems
The chapter concepts are applied to comprehensive business scenarios in the below Practice Video Problems.
Practice Video Problem 7-1: Preparing a planning budget LO2
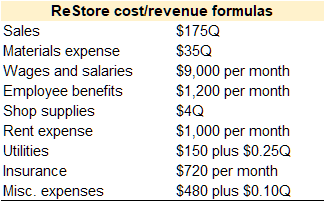
Wanda Wallace owns ReStore a furniture repair and restoration shop. Her sales have increased recently due to a renewed interested in reclaimed and restored furniture made popular on cable television. While the number of furniture repairs has steadily increased, Wanda is concerned that profits are not increasing at the same pace. She decided to prepare a planning budget for March to set revenue and expense targets for the shop. She expects to repair 120 pieces of furniture during March. She developed the following revenue formula and cost formulas for the shop.
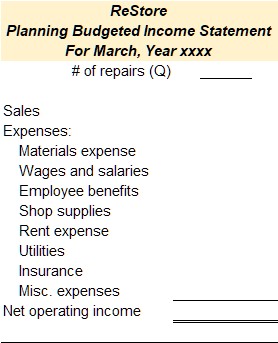
Required 1: Prepare ReStore’s planning budgeted income statement for March.

Practice Video Problem 7-2: Preparing a flexible budget LO4
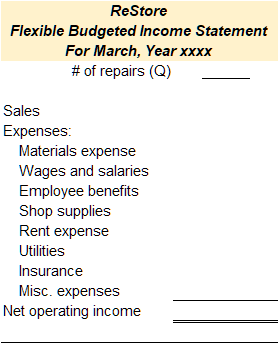
The March planning budget for Wanda’s furniture repair shop, ReStore, was prepared in the first practice video problem. On April 1st the actual results for the month of March were available. She originally planned to repair 120 pieces of furniture during March but she actually repaired 145 pieces of furniture. Using the revenue formula and cost formulas for the shop, prepare a flexible budget for March.
Required 1: Prepare ReStore’s flexible budget for March.


Practice Video Problem 7-3: Prepare a flexible budget performance evaluation report and analyze the variances LOs 5,6,7
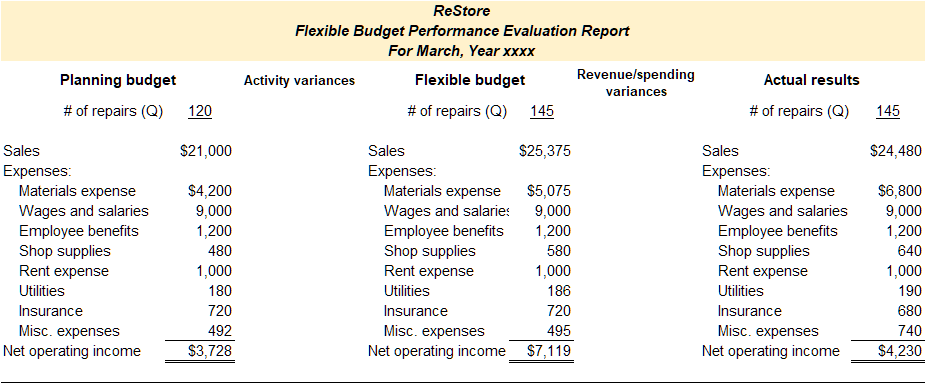
The March planning budget and flexible budget for Wanda’s furniture repair shop, ReStore, were prepared in the first two practice video problems. On April 1st the actual results for the month of March were available. She originally planned to repair 120 pieces of furniture during March but she actually repaired 145 pieces of furniture.
Required 1: Using the data provided from the first two practice video problems prepare a flexible budget performance evaluation report and analyze the variances.

Review Questions
Review questions reinforce the chapter content.
Review 7-1
Review 7-2
Review 7-3
Review 7-4
Review 7-5
Review 7-6
Homework Questions
Homework questions can be used for additional practice or can be assigned in an academic setting. Full feedback is not available online. Homework questions can be assigned, with auto-grading and export, to specific learning management platforms, e.g., Canvas, Blackboard, etc. Contact the author for details.
Homework 7-1
Homework 7-2
Homework 7-3
Homework 7-4
A planning budget is a detailed financial plan for future time periods.
A master budget consists of a set of interrelated but independent budgets that articulate the organization’s sales, production, profit, and financial position for a specified time period.
A cost formula is used to predict the expected cost for a specific expenditure.
A revenue formula is used to predict expected revenue for a given level of sales activity.
Cost behavior is how a cost reacts to changes in production, usage, or sales quantity. Cost behavior is classified as variable, fixed, or mixed.
An activity driver is an activity that causes the incurrence of the variable cost. Common activity drivers are units of sales, units of production, direct labor hours worked, or machine hours used.
Variable costs are the same cost per unit but the total cost depends on the quantity produced, used, or sold.
Fixed cost is the same cost in total regardless of the quantity produced, used, or sold but the per-unit cost changes depending on the quantity produced, used, or sold.
Mixed cost is a cost that has both a variable and a fixed component.
An income statement reports an organization’s sales revenue less its expenses (costs) for specified period of time. On a traditional income statement, costs are classified as product or period.
Product costs are all costs associated with purchasing or producing inventory for resale.
Period costs are all other costs not associated with purchasing or producing inventory for resale but are necessary for sustaining the organization, selling the inventory, and servicing customers.
A flexible budget is the planning budget reforecasted using the actual level of activity instead of the planned level of activity. The flexible budget uses the same cost formulas as the planning budget but is prepared using the actual sales quantity as the cost driver.
Flexible budget variances are the discrepancies found when comparing the planning budget, flexible budget, and actual operating results.
A variance is any discrepancy found when two or more items are compared.
Activity variances are the difference between the planning budget and the flexible budget. Activity variances are solely the result of changing the activity level from the planning quantity used for the planning budget to the actual quantity used for the flexible budget.
Revenue and spending variances are the difference between the flexible budget and the actual financial results. Revenue and spending variances are used to evaluate how well the organization did at achieving revenue, cost, and profit targets.


